Reebok 2013 Annual Report Download - page 64
Download and view the complete annual report
Please find page 64 of the 2013 Reebok annual report below. You can navigate through the pages in the report by either clicking on the pages listed below, or by using the keyword search tool below to find specific information within the annual report.-
 1
1 -
2
-
3
-
4
-
5
-
6
-
7
-
8
-
9
-
10
-
11
-
12
-
13
-
14
-
15
-
16
-
17
-
18
-
19
-
20
-
21
-
22
-
23
-
24
-
25
-
26
-
27
-
28
-
29
-
30
-
31
-
32
-
33
-
34
-
35
-
36
-
37
-
38
-
39
-
40
-
41
-
42
-
43
-
44
-
45
-
46
-
47
-
48
-
49
-
50
-
51
-
52
-
53
-
 54
54 -
 55
55 -
 56
56 -
 57
57 -
 58
58 -
 59
59 -
 60
60 -
 61
61 -
 62
62 -
 63
63 -
 64
64 -
 65
65 -
 66
66 -
 67
67 -
 68
68 -
 69
69 -
 70
70 -
 71
71 -
 72
72 -
 73
73 -
 74
74 -
75
-
76
-
77
-
78
-
79
-
80
-
81
-
82
-
83
-
84
-
85
-
86
-
87
-
88
-
89
-
90
-
91
-
92
-
93
-
94
-
95
-
96
-
97
-
98
-
99
-
100
-
101
-
102
-
103
-
104
-
105
-
106
-
107
-
108
-
109
-
110
-
111
-
112
-
113
-
114
-
115
-
116
-
117
-
118
-
119
-
120
-
121
-
122
-
123
-
124
-
125
-
126
-
127
-
128
-
129
-
130
-
131
-
132
-
133
-
134
-
135
-
136
-
137
-
138
-
139
-
140
-
141
-
142
-
143
-
144
-
145
-
146
-
147
-
148
-
149
-
150
-
151
-
152
-
153
-
154
-
155
-
156
-
157
-
158
-
159
-
160
-
161
-
162
-
163
-
164
-
165
-
166
-
167
-
168
-
169
-
170
-
171
-
172
-
173
-
174
-
175
-
176
-
177
-
178
-
179
-
180
-
181
-
182
-
183
-
184
-
185
-
186
-
187
-
188
-
189
-
190
-
191
-
192
-
193
-
194
-
195
-
196
-
197
-
198
-
199
-
200
-
201
-
202
-
203
-
204
-
205
-
206
-
207
-
208
-
209
-
210
-
211
-
212
-
213
-
214
-
215
-
216
-
217
-
218
-
219
-
220
-
221
-
222
-
223
-
224
-
225
-
226
-
227
-
228
-
229
-
230
-
231
-
232
-
233
-
234
-
235
-
236
-
237
-
238
-
239
-
240
-
241
-
242
-
243
-
244
-
245
-
246
-
247
-
248
-
249
-
250
-
251
-
252
-
253
-
254
-
255
-
256
-
257
-
258
-
259
-
260
-
261
-
262
-
263
-
264
 |
 |
adidas Group
/
2013 Annual Report
To Our Shareholders
60
2013
/
01.10
/
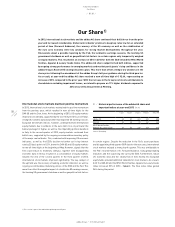
Our Share
04
/
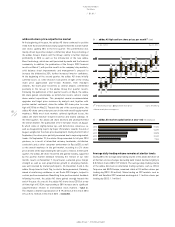
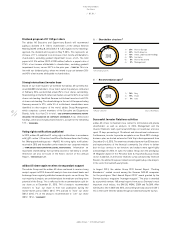
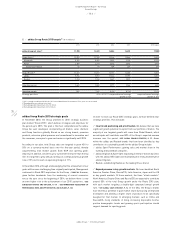
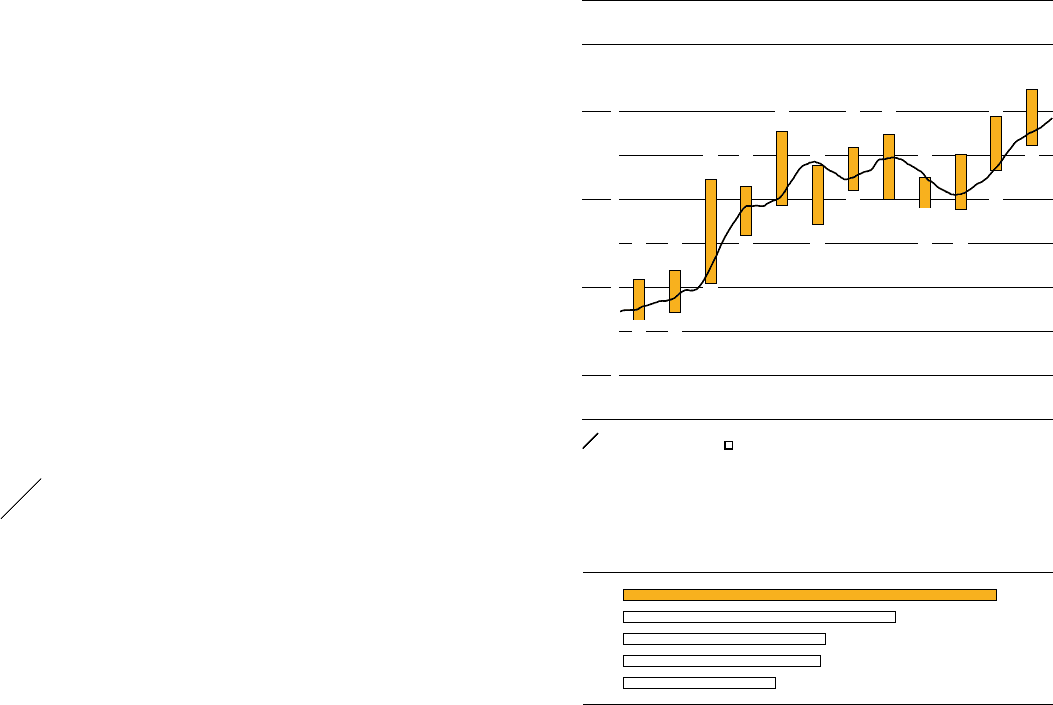
adidas AG high and low share prices per month 1) (in €)
| Jan. 1, 2013 Dec. 31, 2013 |
90
80
70
60
30-day moving average ■ High and low share prices Source: Bloomberg.
1) Based on daily Xetra closing prices.
05
/
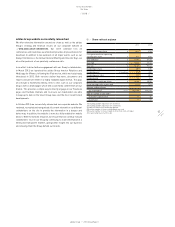
adidas AG market capitalisation at year-end (€ in billions)
2013 19.382
2012 14.087
2011 10.515
2010 10.229
2009 7.902
70.9966.28
72.1067.04
82.3170.28
81.6175.84
87.6679.30
83.8377.14
85.9281.00
87.5480.00
82.5879.02
85.3378.88
89.6083.37
92.6486.14
adidas AG share price outperforms market
At the beginning of the year, the adidas AG share continued its positive
trend from the end of 2012 and clearly outperformed the overall market
and sector, gaining 20% in the first quarter. This performance was
mainly driven by positive analyst commentary about the positioning of
the adidas Group’s brands and the Group’s ability to further improve
profitability in 2013 as well as the introduction of the new adidas
Boost technology, which was well perceived by media and the financial
community. In addition, the publication of the Group’s 2012 financial
results on March 7, with positive results in the company’s key markets,
solid balance sheet improvements and management’s proposal to
increase the dividend by 35%, further increased investor confidence.
At the beginning of the second quarter, the adidas AG share initially
suffered losses, as some investors took profits in light of the strong
share price appreciation year-to-date. However, from mid-April
onwards, the share price recovered, as several analysts commented
positively in the run-up to the adidas Group first quarter results.
Following the publication of first quarter results on May 3, the adidas
AG share gained considerably, as bottom-line results came in clearly
above market expectations. This prompted several recommendation
upgrades and target price increases by analysts and, together with
positive market sentiment, drove the adidas AG share price to a new
high of € 87.66 on May 22. Towards the end of the second quarter, the
adidas AG share came under pressure in line with overall equity market
weakness. While most stock markets suffered significant losses, the
adidas AG share however showed resilience and traded sideways. In
the third quarter, the adidas AG share declined and underperformed
the overall market. The publication of first half year results on August
8, which came in slightly below top- and bottom-line consensus, as
well as disappointing reports by major US retailers towards the end of
August, weighed on the share price development. During the first half of
September, the share price partially recovered due to improving market
trends. On September 19, the adidas Group amended its full year 2013
guidance, as a result of intensified currency headwinds, distribution
constraints and a softer consumer environment in Russia/CIS as well
as the overall weakness in the golf market, resulting in a 3% share
price decline on the day following the ad hoc press release. In the fourth
quarter, the adidas AG share recovered and gained steadily, supported
by the positive market feedback following the release of our nine
months results on November 7. In particular, sustained gross margin
strength as well as over-proportionate growth in emerging markets
was well received by market participants. On December 2 and 3, the
adidas Group Investor Field Trip, hosted in Herzogenaurach, Germany,
aimed at reinforcing confidence in our Route 2015 targets, helped to
sustain positive momentum. Benefiting from positive market feedback
following the event, the adidas AG share gained strongly towards the
end of the year. As a result, the adidas AG share closed 2013 at a new
all-time high of € 92.64, representing a 38% increase and a significant
outperformance relative to international stock markets
/
TABLE 01.
This implies a market capitalisation of € 19.4 billion at the end of 2013
versus € 14.1 billion at the end of 2012
/
DIAGRAM 05.
Average daily trading volume remains at similar levels
During 2013, the average daily trading volume of the adidas AG share on
all German stock exchanges (excluding bank trades) declined slightly to
0.8 million shares (2012: 0.9 million). The average daily trading volume
of the adidas AG share on alternative trading systems, such as CHI-X,
Turquoise and BATS Europe, remained stable at 0.5 million shares per
trading day (2012: 0.5 million). Share trading on OTC markets such as
BOAT and EuroNext OTC remained unchanged at 1.1 million shares per
trading day (2012: 1.1 million).