Reebok 2013 Annual Report Download - page 2
Download and view the complete annual report
Please find page 2 of the 2013 Reebok annual report below. You can navigate through the pages in the report by either clicking on the pages listed below, or by using the keyword search tool below to find specific information within the annual report.-
 1
1 -
 2
2 -
 3
3 -
 4
4 -
 5
5 -
 6
6 -
 7
7 -
 8
8 -
 9
9 -
 10
10 -
 11
11 -
 12
12 -
 13
13 -
14
-
15
-
16
-
17
-
18
-
19
-
20
-
21
-
22
-
23
-
24
-
25
-
26
-
27
-
28
-
29
-
30
-
31
-
32
-
33
-
34
-
35
-
36
-
37
-
38
-
39
-
40
-
41
-
42
-
43
-
44
-
45
-
46
-
47
-
48
-
49
-
50
-
51
-
52
-
53
-
54
-
55
-
56
-
57
-
58
-
59
-
60
-
61
-
62
-
63
-
64
-
65
-
66
-
67
-
68
-
69
-
70
-
71
-
72
-
73
-
74
-
75
-
76
-
77
-
78
-
79
-
80
-
81
-
82
-
83
-
84
-
85
-
86
-
87
-
88
-
89
-
90
-
91
-
92
-
93
-
94
-
95
-
96
-
97
-
98
-
99
-
100
-
101
-
102
-
103
-
104
-
105
-
106
-
107
-
108
-
109
-
110
-
111
-
112
-
113
-
114
-
115
-
116
-
117
-
118
-
119
-
120
-
121
-
122
-
123
-
124
-
125
-
126
-
127
-
128
-
129
-
130
-
131
-
132
-
133
-
134
-
135
-
136
-
137
-
138
-
139
-
140
-
141
-
142
-
143
-
144
-
145
-
146
-
147
-
148
-
149
-
150
-
151
-
152
-
153
-
154
-
155
-
156
-
157
-
158
-
159
-
160
-
161
-
162
-
163
-
164
-
165
-
166
-
167
-
168
-
169
-
170
-
171
-
172
-
173
-
174
-
175
-
176
-
177
-
178
-
179
-
180
-
181
-
182
-
183
-
184
-
185
-
186
-
187
-
188
-
189
-
190
-
191
-
192
-
193
-
194
-
195
-
196
-
197
-
198
-
199
-
200
-
201
-
202
-
203
-
204
-
205
-
206
-
207
-
208
-
209
-
210
-
211
-
212
-
213
-
214
-
215
-
216
-
217
-
218
-
219
-
220
-
221
-
222
-
223
-
224
-
225
-
226
-
227
-
228
-
229
-
230
-
231
-
232
-
233
-
234
-
235
-
236
-
237
-
238
-
239
-
240
-
241
-
242
-
243
-
244
-
245
-
246
-
247
-
248
-
249
-
250
-
251
-
252
-
253
-
254
-
255
-
256
-
257
-
258
-
259
-
260
-
261
-
262
-
263
-
264
 |
 |
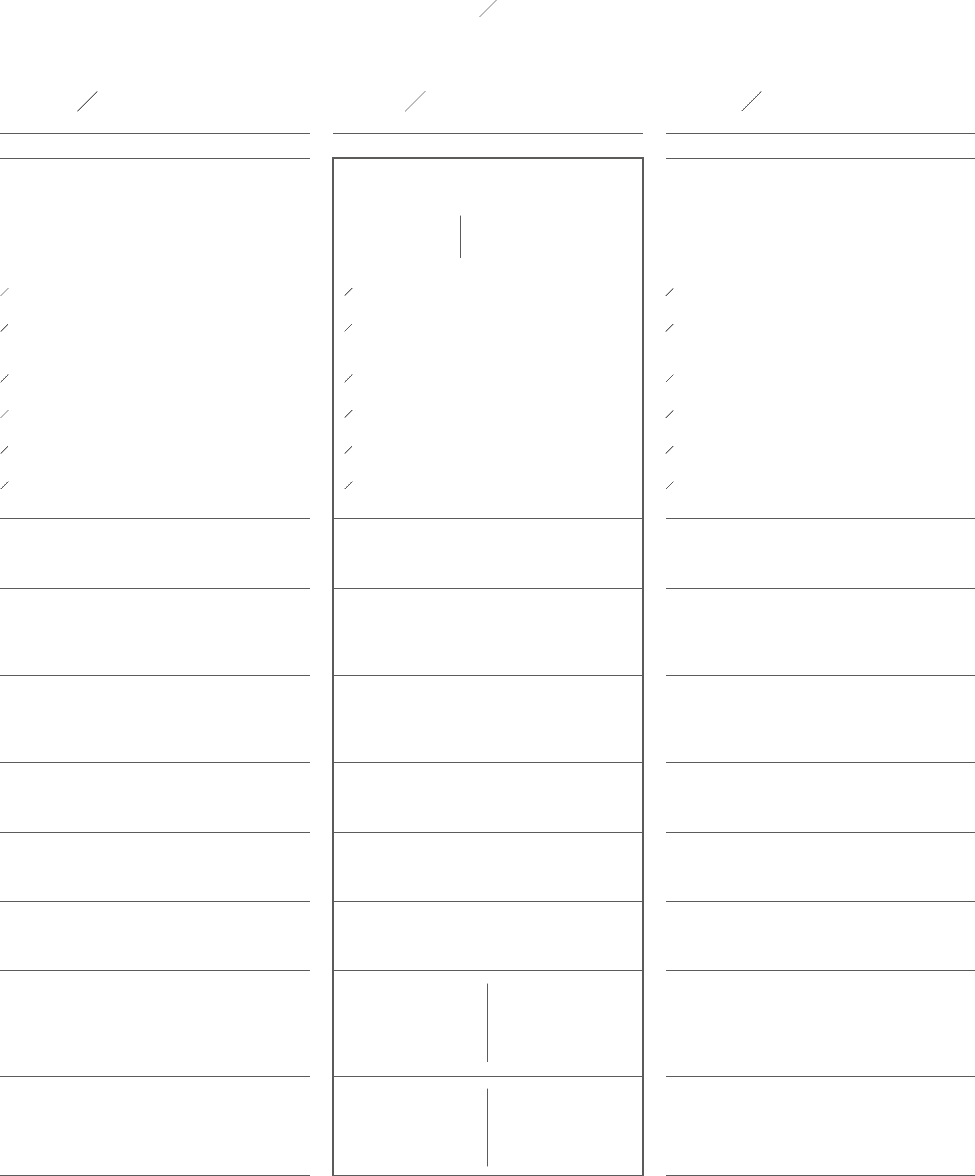
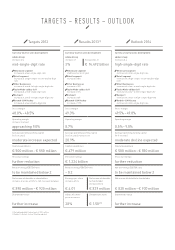
Targets 2013 Results 2013 1) Outlook 2014
Currency-neutral sales development:
adidas Group
increase at a
mid-single-digit rate
Wholesale segment
increase at a low-single-digit rate
Retail segment
increase at a high-single- to low-double-digit
rate
Other Businesses
increase at a mid- to high-single-digit rate
TaylorMade-adidas Golf
increase at a mid-single-digit rate
Rockport
increase at a mid- to high-single-digit rate
Reebok-CCM Hockey
increase at a low-double-digit rate
Currency-neutral sales development:
adidas Group
increase of Group sales of
3% € 14.492 billion
Wholesale segment
stable versus prior year
Retail segment
increase of 8%
Other Businesses
increase of 5%
TaylorMade-adidas Golf
increase of 3%
Rockport
increase of 6%
Reebok-CCM Hockey
increase of 11%
Currency-neutral sales development:
adidas Group
increase at a
high-single-digit rate
Wholesale segment
increase at a mid-single-digit rate
Retail segment
increase at a high-single- to low-double-digit
rate
Other Businesses
increase at a low- to mid-single-digit rate
TaylorMade-adidas Golf
increase at a low- to mid-single-digit rate
Rockport
increase at a mid- to high-single-digit rate
Reebok-CCM Hockey
increase at a mid-single-digit rate
Gross margin
48.0% – 48.5%
Gross margin
49.3%
Gross margin
49.5% – 49.8%
Operating margin
increase to a level
approaching 9.0%
Operating margin
8.7%
Operating margin
8.5% – 9.0%
Average operating working capital
(in % of sales)
moderate increase expected
Average operating working capital
(in % of sales) increases to
20.9%
Average operating working capital
(in % of sales)
moderate decline expected
Capital expenditure
€ 500 million – € 550 million
Capital expenditure
€ 479 million
Capital expenditure
€ 500 million – € 550 million
Gross borrowings
further reduction
Gross borrowings
€ 1.334 billion
Gross borrowings
further reduction
Net borrowings/EBITDA ratio
to be maintained below 2
Net borrowings/EBITDA ratio
– 0.2
Net borrowings/EBITDA ratio
to be maintained below 2
Net income attributable to shareholders
increase at a rate of 12% to 16% to a level between
€ 890 million – € 920 million
Earnings per share
increase 6% to
€ 4.01
Net income attributable
to shareholders
increases 6% to
€ 839 million
Net income attributable to shareholders
€ 830 million – € 930 million
Shareholder value
further increase
adidas AG share
price increases
38%
Dividend per share
€ 1.50 2)
Shareholder value
further increase
TARGETS – RESULTS – OUTLOOK
1) Excluding goodwill impairment of € 52 million.
2) Subject to Annual General Meeting approval.