Reebok 2013 Annual Report Download - page 157
Download and view the complete annual report
Please find page 157 of the 2013 Reebok annual report below. You can navigate through the pages in the report by either clicking on the pages listed below, or by using the keyword search tool below to find specific information within the annual report.-
 1
1 -
2
-
3
-
4
-
5
-
6
-
7
-
8
-
9
-
10
-
11
-
12
-
13
-
14
-
15
-
16
-
17
-
18
-
19
-
20
-
21
-
22
-
23
-
24
-
25
-
26
-
27
-
28
-
29
-
30
-
31
-
32
-
33
-
34
-
35
-
36
-
37
-
38
-
39
-
40
-
41
-
42
-
43
-
44
-
45
-
46
-
47
-
48
-
49
-
50
-
51
-
52
-
53
-
54
-
55
-
56
-
57
-
58
-
59
-
60
-
61
-
62
-
63
-
64
-
65
-
66
-
67
-
68
-
69
-
70
-
71
-
72
-
73
-
74
-
75
-
76
-
77
-
78
-
79
-
80
-
81
-
82
-
83
-
84
-
85
-
86
-
87
-
88
-
89
-
90
-
91
-
92
-
93
-
94
-
95
-
96
-
97
-
98
-
99
-
100
-
101
-
102
-
103
-
104
-
105
-
106
-
107
-
108
-
109
-
110
-
111
-
112
-
113
-
114
-
115
-
116
-
117
-
118
-
119
-
120
-
121
-
122
-
123
-
124
-
125
-
126
-
127
-
128
-
129
-
130
-
131
-
132
-
133
-
134
-
135
-
136
-
137
-
138
-
139
-
140
-
141
-
142
-
143
-
144
-
145
-
146
-
 147
147 -
 148
148 -
 149
149 -
 150
150 -
 151
151 -
 152
152 -
 153
153 -
 154
154 -
 155
155 -
 156
156 -
 157
157 -
 158
158 -
 159
159 -
 160
160 -
 161
161 -
 162
162 -
 163
163 -
 164
164 -
 165
165 -
 166
166 -
 167
167 -
168
-
169
-
170
-
171
-
172
-
173
-
174
-
175
-
176
-
177
-
178
-
179
-
180
-
181
-
182
-
183
-
184
-
185
-
186
-
187
-
188
-
189
-
190
-
191
-
192
-
193
-
194
-
195
-
196
-
197
-
198
-
199
-
200
-
201
-
202
-
203
-
204
-
205
-
206
-
207
-
208
-
209
-
210
-
211
-
212
-
213
-
214
-
215
-
216
-
217
-
218
-
219
-
220
-
221
-
222
-
223
-
224
-
225
-
226
-
227
-
228
-
229
-
230
-
231
-
232
-
233
-
234
-
235
-
236
-
237
-
238
-
239
-
240
-
241
-
242
-
243
-
244
-
245
-
246
-
247
-
248
-
249
-
250
-
251
-
252
-
253
-
254
-
255
-
256
-
257
-
258
-
259
-
260
-
261
-
262
-
263
-
264
 |
 |

adidas Group
/
2013 Annual Report
Group Management Report – Financial Review
153
2013
Subsequent Events and Outlook
/
03.4
/
Sporting goods industry expansion to continue in 2014
In the absence of any major economic shocks, we expect the global
sporting goods industry to grow in 2014. In particular, the industry
should benefit from major sporting events, such as the world’s largest,
the FIFA World Cup, hosted by Brazil, as well as from the 2014 Winter
Olympic Games being held in Sochi, Russia. Many sporting goods
retailers will continue to move to a more omni-retail business model,
and e-commerce and investment in digital are anticipated to remain
growth areas. Following macroeconomic trends, consumer spending
on sporting goods in the emerging economies is expected to grow
faster than in the more developed markets. Private consumption in
many developed economies is forecasted to improve moderately in
2014, supporting modest industry expansion in those markets. While
inflationary pressures are projected to remain relatively contained in
most markets, the recent currency devaluations in several emerging
market countries are likely to lead to significant price increases over
time in the affected countries. In addition, wage growth in the faster-
growing economies is forecasted to continue to add significant costs to
the industry, especially where the industry sources and manufactures
sporting goods.
In Europe, improvements in consumer confidence and domestic
demand should positively impact the sporting goods industry in 2014.
The region’s industry will also gain momentum due to the large number
of European teams participating in the 2014 FIFA World Cup in Brazil
and the importance of football for those markets. This benefit will also
positively impact many European emerging markets, including Russia,
who also qualified. Russia’s sporting goods sector should also gain
additional momentum as the host nation for the 2014 Winter Olympic
Games. Nonetheless, trends of lower growth in disposable income rates
are expected to continue to negatively impact consumer sentiment and
spending, and lessen the sporting goods sector’s expansion in some
European emerging markets, especially in Russia.
In the USA, industry growth rates are expected to be ahead of the
economy’s overall growth. From a category perspective, the trend
towards high-performance technical running and training footwear
looks set to continue. Similarly, advanced and highly innovative apparel
products are also predicted to be significant sporting goods sales drivers
for the year. Lifestyle running is expected to recover and the US golf
market is also forecasted to see modest growth in 2014.
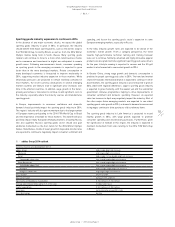
In Greater China, strong wage growth and domestic consumption is
predicted to propel sporting goods sales in 2014. The trend and market
share shift towards international brands is expected to continue. In other
Asian markets, the sporting goods industry is also forecasted to grow in
2014, albeit with regional differences. Japan’s sporting goods industry
is expected to grow modestly, with the weaker yen and the substantial
government stimulus programmes helping to drive improvements in
consumer sentiment and domestic spending. However, an expected
sales tax increase in April may negatively impact the industry. Most of
the other major Asian emerging markets are expected to see robust
sporting goods sales growth in 2014, as domestic demand increases and
rising wages continue to drive purchases of discretionary items.
The sporting goods industry in Latin America is projected to record
healthy growth in 2014, with wage growth expected to promote
consumer spending and discretionary purchases. Furthermore, given
the significance of football in this region, the industry is expected to
maintain momentum from sales relating to the 2014 FIFA World Cup
in Brazil.
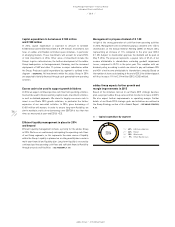
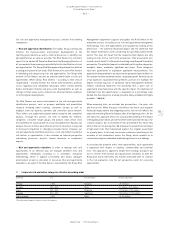
01
/
adidas Group 2014 outlook
Currency-neutral sales development (in %):
adidas Group high-single-digit rate increase
Wholesale mid-single-digit rate increase
Retail high-single- to low-double-digit rate increase
Comparable store sales low- to mid-single-digit rate increase
Other Businesses low- to mid-single-digit rate increase
TaylorMade-adidas Golf low- to mid-single-digit rate increase
Rockport mid- to high-single-digit rate increase
Reebok-CCM Hockey mid-single-digit rate increase
Gross margin 49.5% to 49.8%
Operating margin between 8.5% and 9.0%
Net income attributable to shareholders € 830 million to € 930 million
Average operating working capital in % of net sales moderate decrease
Capital expenditure € 500 million to € 550 million
Store base net increase by around 250 stores
Gross borrowings decline