Reebok 2013 Annual Report Download - page 176
Download and view the complete annual report
Please find page 176 of the 2013 Reebok annual report below. You can navigate through the pages in the report by either clicking on the pages listed below, or by using the keyword search tool below to find specific information within the annual report.-
 1
1 -
2
-
3
-
4
-
5
-
6
-
7
-
8
-
9
-
10
-
11
-
12
-
13
-
14
-
15
-
16
-
17
-
18
-
19
-
20
-
21
-
22
-
23
-
24
-
25
-
26
-
27
-
28
-
29
-
30
-
31
-
32
-
33
-
34
-
35
-
36
-
37
-
38
-
39
-
40
-
41
-
42
-
43
-
44
-
45
-
46
-
47
-
48
-
49
-
50
-
51
-
52
-
53
-
54
-
55
-
56
-
57
-
58
-
59
-
60
-
61
-
62
-
63
-
64
-
65
-
66
-
67
-
68
-
69
-
70
-
71
-
72
-
73
-
74
-
75
-
76
-
77
-
78
-
79
-
80
-
81
-
82
-
83
-
84
-
85
-
86
-
87
-
88
-
89
-
90
-
91
-
92
-
93
-
94
-
95
-
96
-
97
-
98
-
99
-
100
-
101
-
102
-
103
-
104
-
105
-
106
-
107
-
108
-
109
-
110
-
111
-
112
-
113
-
114
-
115
-
116
-
117
-
118
-
119
-
120
-
121
-
122
-
123
-
124
-
125
-
126
-
127
-
128
-
129
-
130
-
131
-
132
-
133
-
134
-
135
-
136
-
137
-
138
-
139
-
140
-
141
-
142
-
143
-
144
-
145
-
146
-
147
-
148
-
149
-
150
-
151
-
152
-
153
-
154
-
155
-
156
-
157
-
158
-
159
-
160
-
161
-
162
-
163
-
164
-
165
-
 166
166 -
 167
167 -
 168
168 -
 169
169 -
 170
170 -
 171
171 -
 172
172 -
 173
173 -
 174
174 -
 175
175 -
 176
176 -
 177
177 -
 178
178 -
 179
179 -
 180
180 -
 181
181 -
 182
182 -
 183
183 -
 184
184 -
 185
185 -
 186
186 -
187
-
188
-
189
-
190
-
191
-
192
-
193
-
194
-
195
-
196
-
197
-
198
-
199
-
200
-
201
-
202
-
203
-
204
-
205
-
206
-
207
-
208
-
209
-
210
-
211
-
212
-
213
-
214
-
215
-
216
-
217
-
218
-
219
-
220
-
221
-
222
-
223
-
224
-
225
-
226
-
227
-
228
-
229
-
230
-
231
-
232
-
233
-
234
-
235
-
236
-
237
-
238
-
239
-
240
-
241
-
242
-
243
-
244
-
245
-
246
-
247
-
248
-
249
-
250
-
251
-
252
-
253
-
254
-
255
-
256
-
257
-
258
-
259
-
260
-
261
-
262
-
263
-
264
 |
 |
adidas Group
/
2013 Annual Report
Group Management Report – Financial Review
172
2013
/
03.5
/
Risk and Opportunity Report
/
Financial Risks
The adidas Group Treasury department arranges currency and interest
rate hedges, and invests cash, with major banks of a high credit standing
throughout the world. adidas Group companies are authorised to
work with banks rated BBB+ or higher. Only in exceptional cases are
subsidiaries authorised to work with banks rated lower than BBB+.
To limit risk in these cases, restrictions are clearly stipulated, such
as maximum cash deposit levels. In addition, the credit default swap
premiums of our partner banks are monitored on a monthly basis. In the
event that the defined threshold is exceeded, credit balances are shifted
to banks compliant with the limit.
As financial market conditions remain challenging and highly volatile
and due to our overall investment volume, we believe that the
financial impact could be major (2012: moderate) but the likelihood of
materialising is unlikely. Furthermore, we believe our risk concentration
is limited due to the broad distribution of our investment business with
more than 20 banks. At December 31, 2013, no bank accounted for more
than 7% of our investments and the average concentration, including
subsidiaries’ short-term deposits in local banks, was 1%. This leads to a
maximum exposure of € 100 million in the event of default of any single
bank. We have further diversified our investment exposure by investing
into AAA-rated money market funds.
In addition, we held derivatives with a positive fair market value in the
amount of € 59 million. The maximum exposure to any single bank
resulting from these assets amounted to € 10 million and the average
concentration was 6%.
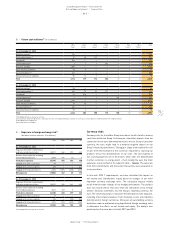
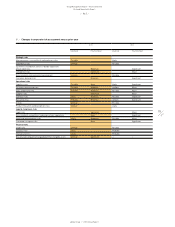
According to IFRS 7, the adjacent table includes further information
about set-off possibilities of derivative financial assets and liabilities
/
TABLE 04. The majority of agreements between financial institutions
and the adidas Group include a mutual right to set-off. However, these
agreements do not meet the criteria for offsetting in the statement of
financial position, because the right to set-off is enforceable only in the
event of counterparty defaults.
The carrying amounts of recognised derivative financial instruments,
which are subject to the mentioned agreements, are presented in the
adjacent table
/
TABLE 04.
Financing and liquidity risks
Liquidity risks arise from not having the necessary resources available
to meet maturing liabilities with regard to timing, volume and currency
structure. In addition, the adidas Group faces the risk of having to
accept unfavourable financing terms due to liquidity restraints. Our
Group Treasury department uses an efficient cash management system
to manage liquidity risk. At December 31, 2013, Group cash, cash
equivalents and marketable securities amounted to € 1.629 billion (2012:
€ 1.935 billion). Moreover, our Group maintains € 1.652 billion bilateral
credit lines and a € 500 million committed long-term syndicated loan
facility with international banks, which does not include a market
disruption clause. The € 2.152 billion in credit lines are designed to
ensure sufficient liquidity at all times
/
SEE TREASURY, P. 135.
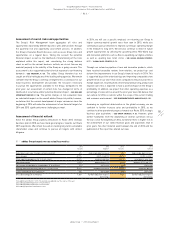
Future cash outflows arising from financial liabilities that are recognised
in the Consolidated Statement of Financial Position are presented in the
following table
/
TABLE 05.
This includes payments to settle obligations from borrowings as well as
cash outflows from cash-settled derivatives with negative market values.
Financial liabilities that may be settled in advance without penalty are
included on the basis of the earliest date of potential repayment. Cash
flows for variable-interest liabilities are determined with reference to
the conditions at the balance sheet date.
We ended the year 2013 with net cash of € 295 million (2012:
€ 448 million). Thus the ratio of net borrowings over EBITDA decreased
to –0.2 times at year-end, which is in line with the Group’s medium-term
guideline of less than two times. In light of our available credit lines,
financing structure and business model, our risk assessment remains
unchanged. We assess the potential impact of these risks on the Group
as minor and the likelihood of materialising as unlikely.
04
/
Set-off possibilities of derivative financial assets and
liabilities (€ in millions)
2013 2012
Assets
Gross amounts of recognised financial assets 59 61
Financial instruments which qualify for
set-off in the statement of financial position 0 0
Net amounts of financial assets presented in the
statement of financial position 59 61
Set-off possible due to master agreements (53) (48)
Total net amount of assets 6 13
Liabilities
Gross amounts of recognised financial liabilities (93) (60)
Financial instruments which qualify for
set-off in the statement of financial position 0 0
Net amounts of financial liabilities presented in the
statement of financial position (93) (60)
Set-off possible due to master agreements 53 48
Total net amount of liabilities (40) (12)