Reebok 2013 Annual Report Download - page 140
Download and view the complete annual report
Please find page 140 of the 2013 Reebok annual report below. You can navigate through the pages in the report by either clicking on the pages listed below, or by using the keyword search tool below to find specific information within the annual report.-
 1
1 -
2
-
3
-
4
-
5
-
6
-
7
-
8
-
9
-
10
-
11
-
12
-
13
-
14
-
15
-
16
-
17
-
18
-
19
-
20
-
21
-
22
-
23
-
24
-
25
-
26
-
27
-
28
-
29
-
30
-
31
-
32
-
33
-
34
-
35
-
36
-
37
-
38
-
39
-
40
-
41
-
42
-
43
-
44
-
45
-
46
-
47
-
48
-
49
-
50
-
51
-
52
-
53
-
54
-
55
-
56
-
57
-
58
-
59
-
60
-
61
-
62
-
63
-
64
-
65
-
66
-
67
-
68
-
69
-
70
-
71
-
72
-
73
-
74
-
75
-
76
-
77
-
78
-
79
-
80
-
81
-
82
-
83
-
84
-
85
-
86
-
87
-
88
-
89
-
90
-
91
-
92
-
93
-
94
-
95
-
96
-
97
-
98
-
99
-
100
-
101
-
102
-
103
-
104
-
105
-
106
-
107
-
108
-
109
-
110
-
111
-
112
-
113
-
114
-
115
-
116
-
117
-
118
-
119
-
120
-
121
-
122
-
123
-
124
-
125
-
126
-
127
-
128
-
129
-
 130
130 -
 131
131 -
 132
132 -
 133
133 -
 134
134 -
 135
135 -
 136
136 -
 137
137 -
 138
138 -
 139
139 -
 140
140 -
 141
141 -
 142
142 -
 143
143 -
 144
144 -
 145
145 -
 146
146 -
 147
147 -
 148
148 -
 149
149 -
 150
150 -
151
-
152
-
153
-
154
-
155
-
156
-
157
-
158
-
159
-
160
-
161
-
162
-
163
-
164
-
165
-
166
-
167
-
168
-
169
-
170
-
171
-
172
-
173
-
174
-
175
-
176
-
177
-
178
-
179
-
180
-
181
-
182
-
183
-
184
-
185
-
186
-
187
-
188
-
189
-
190
-
191
-
192
-
193
-
194
-
195
-
196
-
197
-
198
-
199
-
200
-
201
-
202
-
203
-
204
-
205
-
206
-
207
-
208
-
209
-
210
-
211
-
212
-
213
-
214
-
215
-
216
-
217
-
218
-
219
-
220
-
221
-
222
-
223
-
224
-
225
-
226
-
227
-
228
-
229
-
230
-
231
-
232
-
233
-
234
-
235
-
236
-
237
-
238
-
239
-
240
-
241
-
242
-
243
-
244
-
245
-
246
-
247
-
248
-
249
-
250
-
251
-
252
-
253
-
254
-
255
-
256
-
257
-
258
-
259
-
260
-
261
-
262
-
263
-
264
 |
 |
adidas Group
/
2013 Annual Report
Group Management Report – Financial Review
136
2013
/
03.2
/
Group Business Performance
/
Treasury
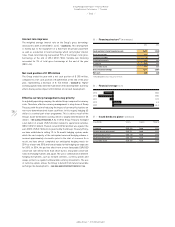
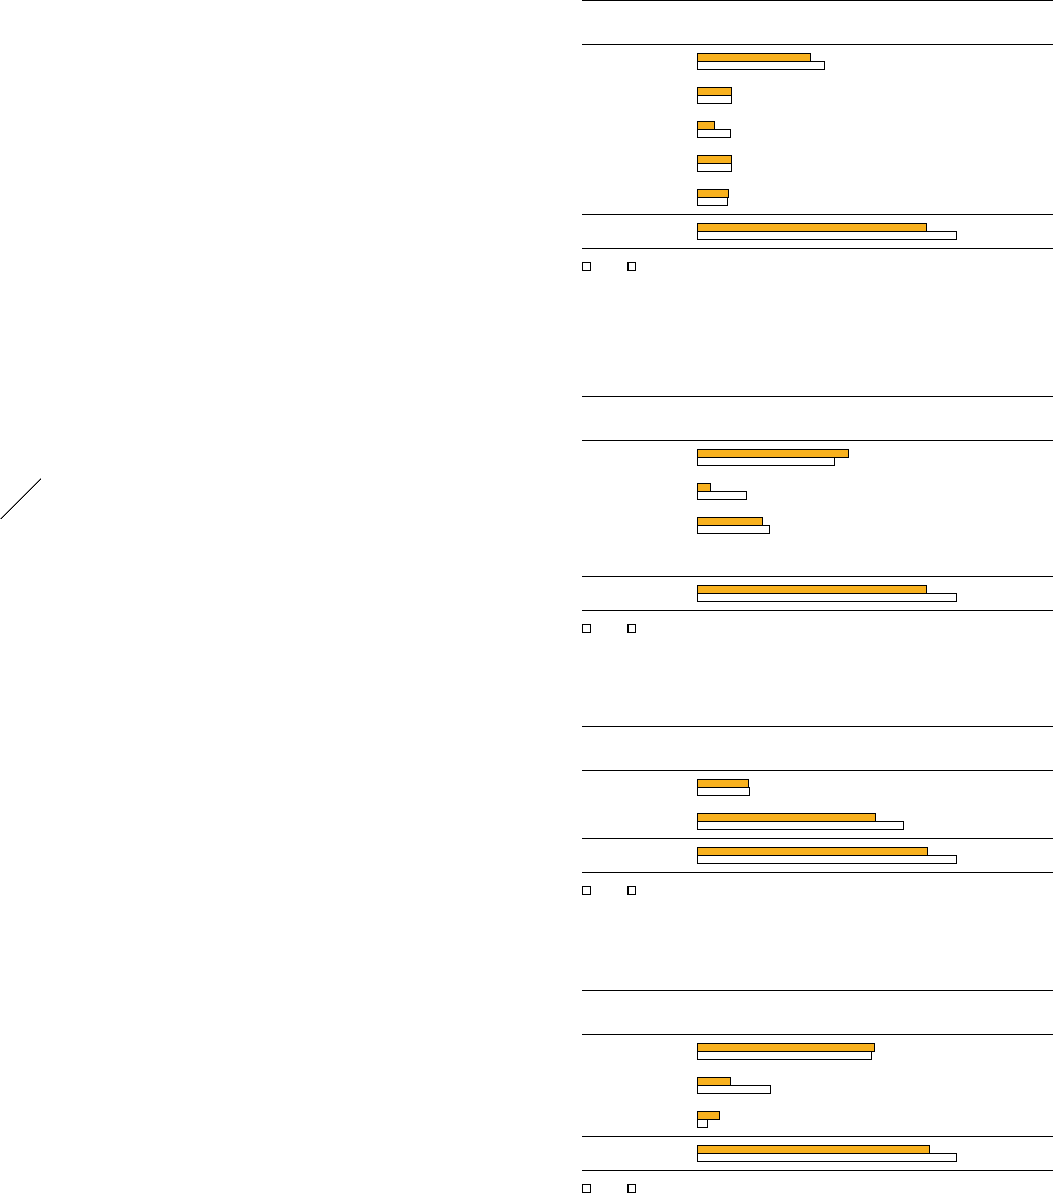
47
/
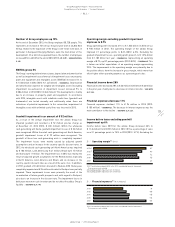
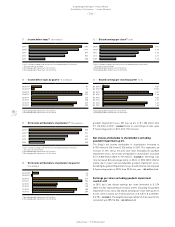
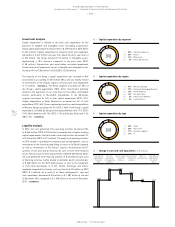
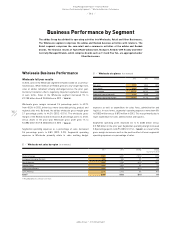
Total credit facilities (€ in millions)
2013 2012
Bilateral
credit facilities 1,652 1,863
Syndicated
loan facility 500 500
Private placements 248 480
Eurobond 500 499
Convertible bond 460 449
Total 3,360 3,791
■ 2013 ■ 2012
49
/
Bilateral credit lines (€ in millions)
2013 2012
Committed 370 376
Uncommitted 1,282 1,487
Total 1,652 1,863
■ 2013 ■ 2012
48
/
Remaining time to maturity of available facilities
(€ in millions)
2013 2012
< 1 year 2,207 2,014
1 to 3 years 193 714
3 to 5 years 960 1,063
> 5 years 00
Total 3,360 3,791
■ 2013 ■ 2012
50
/
Currency split of gross borrowings (€ in millions)
2013 2012
EUR 1,016 1,004
USD 193 424
All others 125 59
Total 1,334 1,487
■ 2013 ■ 2012
Centralised treasury function
In accordance with our Group’s Treasury Policy, all worldwide credit lines
are directly or indirectly managed by the Group Treasury department.
Portions of those lines are allocated to the Group’s subsidiaries
and backed by adidas AG guarantees. As a result of this centralised
liquidity management, the Group is well positioned to allocate
resources efficiently throughout the organisation. The Group’s debt is
generally unsecured and may include standard financial covenants,
which are reviewed on a quarterly basis. We maintain good relations
with numerous partner banks, thereby avoiding a high dependency
on any single financial institution. Banking partners of the Group
and our subsidiaries are required to have at least a BBB+ long-term
investment grade rating by Standard & Poor’s or an equivalent rating
by another leading rating agency. Only in exceptional cases are Group
companies authorised to work with banks with a lower rating
/
SEE
RISK AND OPPORTUNITY REPORT, P. 158. To ensure optimal allocation of the
Group’s liquid financial resources, subsidiaries transfer excess cash
to the Group’s headquarters in all instances where it is legally and
economically feasible. In addition, Group Treasury is currently rolling
out a global standardisation and consolidation of cash management and
payment processes, including the set-up of automated, cross-border
cash pools, a payment factory and a new in-house bank concept. While
2013 has seen the core implementation of standardised and consolidated
cash management and payment processes, these functionalities will be
further rolled out in the course of 2014.
Group financial flexibility
The adidas Group’s financial flexibility is ensured by the availability of
unutilised credit facilities in an amount of € 2.026 billion at the end of
2013 (2012: € 2.304 billion). These include a committed syndicated loan
facility of € 500 million as well as bilateral credit lines at different banks
of € 1.526 billion (2012: € 1.804 billion). The syndicated loan facility
has a remaining time to maturity of four years and incorporates two
one-year extension options. We monitor the ongoing need for available
credit lines based on the current level of debt as well as future financing
requirements.
Bilateral credit lines decrease
At the end of 2013, bilateral credit lines declined 11% to € 1.652 billion
compared to € 1.863 billion in the prior year. Credit lines decreased in
line with lower financing needs and growing cash surpluses. Committed
and uncommitted credit lines represent approximately 22% and 78%
of total short-term bilateral credit lines, respectively (2012: 20% and
80%)
/
DIAGRAM 49.