Reebok 2013 Annual Report Download - page 125
Download and view the complete annual report
Please find page 125 of the 2013 Reebok annual report below. You can navigate through the pages in the report by either clicking on the pages listed below, or by using the keyword search tool below to find specific information within the annual report.-
 1
1 -
2
-
3
-
4
-
5
-
6
-
7
-
8
-
9
-
10
-
11
-
12
-
13
-
14
-
15
-
16
-
17
-
18
-
19
-
20
-
21
-
22
-
23
-
24
-
25
-
26
-
27
-
28
-
29
-
30
-
31
-
32
-
33
-
34
-
35
-
36
-
37
-
38
-
39
-
40
-
41
-
42
-
43
-
44
-
45
-
46
-
47
-
48
-
49
-
50
-
51
-
52
-
53
-
54
-
55
-
56
-
57
-
58
-
59
-
60
-
61
-
62
-
63
-
64
-
65
-
66
-
67
-
68
-
69
-
70
-
71
-
72
-
73
-
74
-
75
-
76
-
77
-
78
-
79
-
80
-
81
-
82
-
83
-
84
-
85
-
86
-
87
-
88
-
89
-
90
-
91
-
92
-
93
-
94
-
95
-
96
-
97
-
98
-
99
-
100
-
101
-
102
-
103
-
104
-
105
-
106
-
107
-
108
-
109
-
110
-
111
-
112
-
113
-
114
-
 115
115 -
 116
116 -
 117
117 -
 118
118 -
 119
119 -
 120
120 -
 121
121 -
 122
122 -
 123
123 -
 124
124 -
 125
125 -
 126
126 -
 127
127 -
 128
128 -
 129
129 -
 130
130 -
 131
131 -
 132
132 -
 133
133 -
 134
134 -
 135
135 -
136
-
137
-
138
-
139
-
140
-
141
-
142
-
143
-
144
-
145
-
146
-
147
-
148
-
149
-
150
-
151
-
152
-
153
-
154
-
155
-
156
-
157
-
158
-
159
-
160
-
161
-
162
-
163
-
164
-
165
-
166
-
167
-
168
-
169
-
170
-
171
-
172
-
173
-
174
-
175
-
176
-
177
-
178
-
179
-
180
-
181
-
182
-
183
-
184
-
185
-
186
-
187
-
188
-
189
-
190
-
191
-
192
-
193
-
194
-
195
-
196
-
197
-
198
-
199
-
200
-
201
-
202
-
203
-
204
-
205
-
206
-
207
-
208
-
209
-
210
-
211
-
212
-
213
-
214
-
215
-
216
-
217
-
218
-
219
-
220
-
221
-
222
-
223
-
224
-
225
-
226
-
227
-
228
-
229
-
230
-
231
-
232
-
233
-
234
-
235
-
236
-
237
-
238
-
239
-
240
-
241
-
242
-
243
-
244
-
245
-
246
-
247
-
248
-
249
-
250
-
251
-
252
-
253
-
254
-
255
-
256
-
257
-
258
-
259
-
260
-
261
-
262
-
263
-
264
 |
 |
adidas Group
/
2013 Annual Report
Group Management Report – Financial Review
121
2013
Internal Group Management System
/
03.1
/
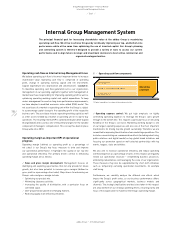
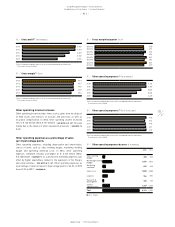
Structured performance measurement system
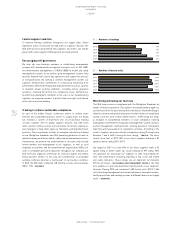
We have developed an extensive performance measurement system,
which utilises a variety of tools to measure the performance of the
adidas Group. The Group’s key financial metrics are monitored and
compared against budget as well as a rolling forecast on a monthly
basis. The focus is on operating cash flow, CACC, net sales, operating
margin, operating working capital and net cash development
/
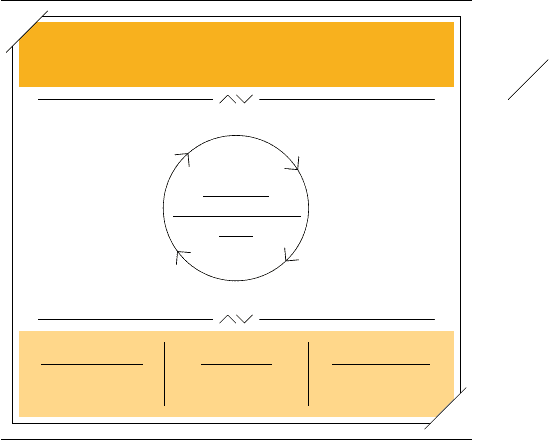
DIAGRAM
02. When negative deviations exist between actual and target numbers,
we perform a detailed analysis to identify and address the cause. If
necessary, action plans are implemented to optimise the development
of the Group’s operating performance. We also benchmark the Group’s
financial results with those of our major competitors on a regular basis.
To assess current sales and profitability development, management
analyses sell-through information from our own-retail activities as well
as short-term replenishment orders from retailers.
Taking into account year-to-date performance as well as opportunities
and risks, the Group’s full year financial performance is forecasted on a
quarterly basis. In this respect, backlogs, sell-through data, feedback
from own-retail stores and retail partners are assessed as available.
Finally, as a further early indicator for future performance, the results
of any relevant recent market and consumer research are assessed as
available.
To ensure an effective performance measurement process at all times,
in 2012 we introduced a new Group-wide management reporting
system, enabling automated and standardised management reporting,
thereby combining backward- and forward-looking information from
different data sources. Having laid the foundation in 2012, the core
system implementation started in 2013. The platform is used as a
major reference point on a global level, across all markets, functions
and brands. It consolidates and harmonises different reporting tools
and systems within the adidas Group and enables fact-based decision-
making on a senior management level. In 2014, the new reporting
system will see further enhancement, with additional data sources and
functionalities being added.
Enhanced integrated business planning and
management approach
In order to further optimise profitability and working capital efficiency
as well as operating cash flow development, in 2013 we continued the
Group-wide Integrated Business Planning initiative (IBP). This initiative
focuses on developing and forming an enhanced forecasting approach
by aligning processes and timelines of major business functions such
as marketing, sales and operations at a market and global level. The
centre-point of this approach is to improve the reliability of future
business planning, leading to a new efficiency level of order book
building and conversion. This, in turn, is expected to lead to improving
full-margin business.
The whole process is set up in a rhythm and timeframe to facilitate
full cross-functional alignment and forecasting clarity in advance of
important business decision processes – in particular those related
to product pricing, range building, material purchasing or production
capacity fixing. To create a seamless flow between achieving our
strategic objectives and implementing operational plans, we follow a
rolling two-year time horizon. This ensures more focus on the mid-term
perspective, while at the same time highlighting relevant information
around short-term business events and volatilities. All target-setting is
fully embedded into the integrated planning process and communicated
in advance of all relevant business milestones. While the process roll-out
was successfully finalised in 2012, 2013 saw important system changes
and data restructuring, initiated to make the approach sustainable and
integrated in the Group’s overall value chain. With the start of 2014,
transparency on the effectiveness of IBP will increase, as specific KPIs
with a direct link to business performance have been identified and are
being monitored.
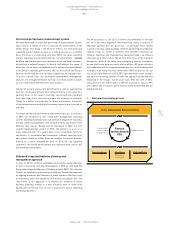
Senior Management Business Review
Operations Review Sales Review
All channels
All markets
Marketing Review
Feedback results
Reconciliation
process led by
Group Finance
Financial
and non-financial
KPIs
03
/
Best-practice planning process