Reebok 2013 Annual Report Download - page 149
Download and view the complete annual report
Please find page 149 of the 2013 Reebok annual report below. You can navigate through the pages in the report by either clicking on the pages listed below, or by using the keyword search tool below to find specific information within the annual report.-
 1
1 -
2
-
3
-
4
-
5
-
6
-
7
-
8
-
9
-
10
-
11
-
12
-
13
-
14
-
15
-
16
-
17
-
18
-
19
-
20
-
21
-
22
-
23
-
24
-
25
-
26
-
27
-
28
-
29
-
30
-
31
-
32
-
33
-
34
-
35
-
36
-
37
-
38
-
39
-
40
-
41
-
42
-
43
-
44
-
45
-
46
-
47
-
48
-
49
-
50
-
51
-
52
-
53
-
54
-
55
-
56
-
57
-
58
-
59
-
60
-
61
-
62
-
63
-
64
-
65
-
66
-
67
-
68
-
69
-
70
-
71
-
72
-
73
-
74
-
75
-
76
-
77
-
78
-
79
-
80
-
81
-
82
-
83
-
84
-
85
-
86
-
87
-
88
-
89
-
90
-
91
-
92
-
93
-
94
-
95
-
96
-
97
-
98
-
99
-
100
-
101
-
102
-
103
-
104
-
105
-
106
-
107
-
108
-
109
-
110
-
111
-
112
-
113
-
114
-
115
-
116
-
117
-
118
-
119
-
120
-
121
-
122
-
123
-
124
-
125
-
126
-
127
-
128
-
129
-
130
-
131
-
132
-
133
-
134
-
135
-
136
-
137
-
138
-
 139
139 -
 140
140 -
 141
141 -
 142
142 -
 143
143 -
 144
144 -
 145
145 -
 146
146 -
 147
147 -
 148
148 -
 149
149 -
 150
150 -
 151
151 -
 152
152 -
 153
153 -
 154
154 -
 155
155 -
 156
156 -
 157
157 -
 158
158 -
 159
159 -
160
-
161
-
162
-
163
-
164
-
165
-
166
-
167
-
168
-
169
-
170
-
171
-
172
-
173
-
174
-
175
-
176
-
177
-
178
-
179
-
180
-
181
-
182
-
183
-
184
-
185
-
186
-
187
-
188
-
189
-
190
-
191
-
192
-
193
-
194
-
195
-
196
-
197
-
198
-
199
-
200
-
201
-
202
-
203
-
204
-
205
-
206
-
207
-
208
-
209
-
210
-
211
-
212
-
213
-
214
-
215
-
216
-
217
-
218
-
219
-
220
-
221
-
222
-
223
-
224
-
225
-
226
-
227
-
228
-
229
-
230
-
231
-
232
-
233
-
234
-
235
-
236
-
237
-
238
-
239
-
240
-
241
-
242
-
243
-
244
-
245
-
246
-
247
-
248
-
249
-
250
-
251
-
252
-
253
-
254
-
255
-
256
-
257
-
258
-
259
-
260
-
261
-
262
-
263
-
264
 |
 |
adidas Group
/
2013 Annual Report
Group Management Report – Financial Review
145
2013
/
03.3
/
Business Performance by Segment
/
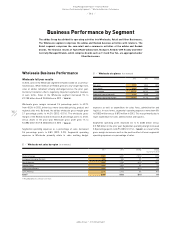
Wholesale Business Performance
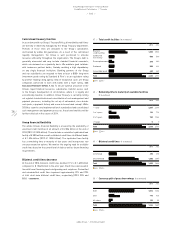
Wholesale development by region
In 2013, currency-neutral sales for the Wholesale segment increased
in all regions except Western Europe and North America. Currency-
neutral revenues in Western Europe decreased 9%, mainly due to sales
declines in the UK, Italy and Spain. Currency-neutral sales in European
Emerging Markets rose 8%, as a result of growth in most of the region’s
major markets. Currency-neutral Wholesale sales in North America
were down 3% due to declines in the USA. Revenues in Greater China
increased 7% on a currency-neutral basis. Sales in Other Asian Markets
grew 5% on a currency-neutral basis, driven by strong increases in
South Korea, India and Australia. In Latin America, currency-neutral
sales were up 16%, supported by double-digit sales growth in most of
the region’s major markets. Currency translation effects had a negative
impact on regional sales in euro terms
/
TABLE 02.
Wholesale development by brand
In 2013, adidas Sport Performance wholesale revenues grew 1% on a
currency-neutral basis. Growth was mainly a result of sales increases
in the training, running, football and outdoor categories, partly offset
by declines in categories closely related to prior year major sporting
events, such as Olympic sports. Currency translation effects had a
negative impact on revenues in euro terms. adidas Sport Performance
sales decreased 4% to € 5.917 billion from € 6.187 billion in the prior
year.
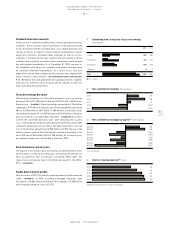
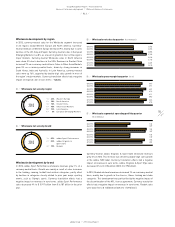
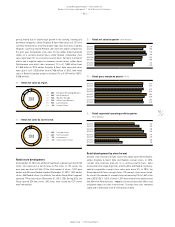
04
/
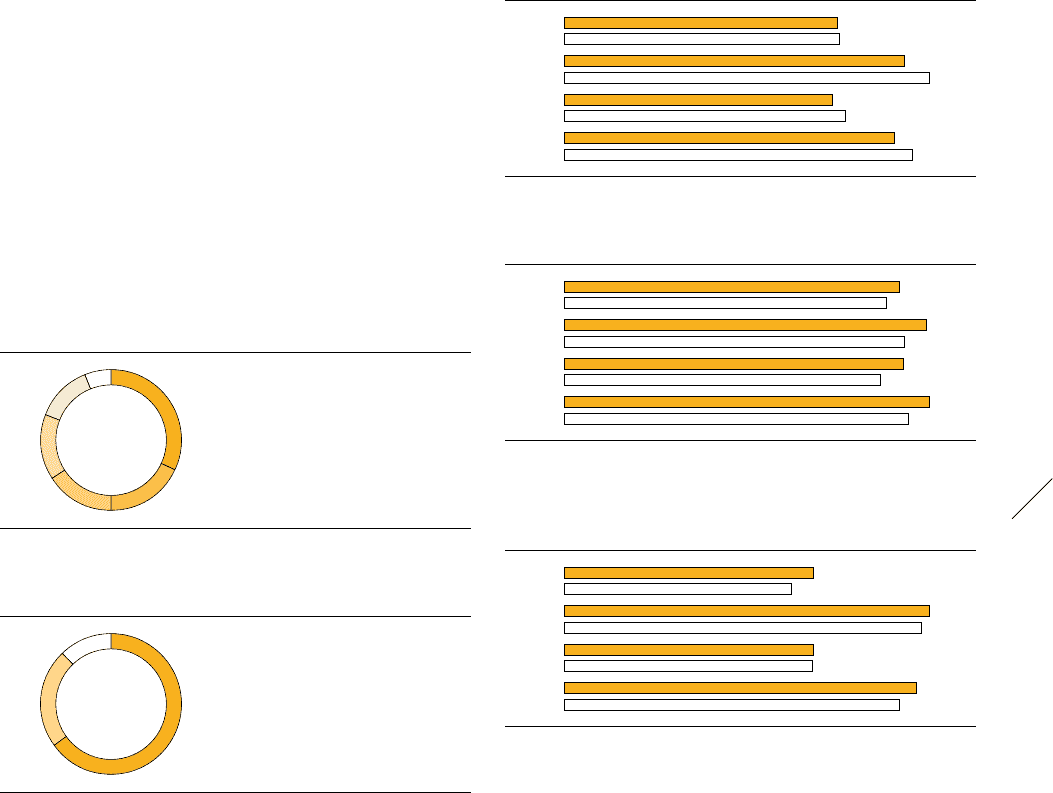
Wholesale net sales by brand
2013
1
/
65% adidas Sport Performance
2
/
23% adidas Originals &
Sport Style
3
/
12% Reebok
1
2
3
03
/
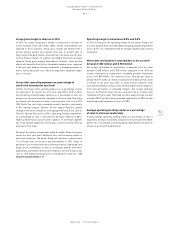
Wholesale net sales by region
2013
1
/
32% Western Europe
2
/
18% North America
3
/
16% Greater China
4
/
15% Other Asian Markets
5
/
13% Latin America
6
/
6% European Emerging Markets
6
5 1
2
3
4
Currency-neutral adidas Originals & Sport Style wholesale revenues
grew 2% in 2013. This increase was driven by double-digit sales growth
at the adidas NEO label. Currency translation effects had a negative
impact on revenues in euro terms. adidas Originals & Sport Style sales
decreased 2% to € 2.156 billion (2012: € 2.193 billion).
In 2013, Reebok wholesale revenues increased 1% on a currency-neutral
basis, mainly due to growth in the classics, fitness training and studio
categories. This development was partly offset by the negative impact of
the discontinuation of the NFL licence agreement. Currency translation
effects had a negative impact on revenues in euro terms. Reebok sales
were down 5% to € 1.050 billion (2012: € 1.109 billion).
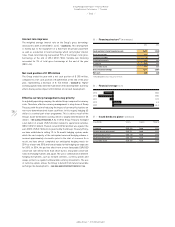
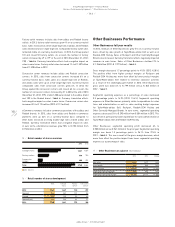
05
/
Wholesale net sales by quarter (€ in millions)
Q4 2013 2,052
Q4 2012 2,063
Q3 2013 2,553
Q3 2012 2,743
Q2 2013 2,014
Q2 2012 2,113
Q1 2013 2,481
Q1 2012 2,614
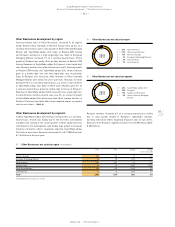
06
/
Wholesale gross margin by quarter (in %)
Q4 2013 40.7
Q4 2012 39.1
Q3 2013 43.9
Q3 2012 41.3
Q2 2013 41.1
Q2 2012 38.3
Q1 2013 44.3
Q1 2012 41.8
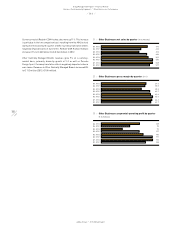
07
/
Wholesale segmental operating profit by quarter
(€ in millions)
Q4 2013 632
Q4 2012 577
Q3 2013 926
Q3 2012 907
Q2 2013 632
Q2 2012 630
Q1 2013 893
Q1 2012 851