Reebok 2013 Annual Report Download - page 131
Download and view the complete annual report
Please find page 131 of the 2013 Reebok annual report below. You can navigate through the pages in the report by either clicking on the pages listed below, or by using the keyword search tool below to find specific information within the annual report.-
 1
1 -
2
-
3
-
4
-
5
-
6
-
7
-
8
-
9
-
10
-
11
-
12
-
13
-
14
-
15
-
16
-
17
-
18
-
19
-
20
-
21
-
22
-
23
-
24
-
25
-
26
-
27
-
28
-
29
-
30
-
31
-
32
-
33
-
34
-
35
-
36
-
37
-
38
-
39
-
40
-
41
-
42
-
43
-
44
-
45
-
46
-
47
-
48
-
49
-
50
-
51
-
52
-
53
-
54
-
55
-
56
-
57
-
58
-
59
-
60
-
61
-
62
-
63
-
64
-
65
-
66
-
67
-
68
-
69
-
70
-
71
-
72
-
73
-
74
-
75
-
76
-
77
-
78
-
79
-
80
-
81
-
82
-
83
-
84
-
85
-
86
-
87
-
88
-
89
-
90
-
91
-
92
-
93
-
94
-
95
-
96
-
97
-
98
-
99
-
100
-
101
-
102
-
103
-
104
-
105
-
106
-
107
-
108
-
109
-
110
-
111
-
112
-
113
-
114
-
115
-
116
-
117
-
118
-
119
-
120
-
 121
121 -
 122
122 -
 123
123 -
 124
124 -
 125
125 -
 126
126 -
 127
127 -
 128
128 -
 129
129 -
 130
130 -
 131
131 -
 132
132 -
 133
133 -
 134
134 -
 135
135 -
 136
136 -
 137
137 -
 138
138 -
 139
139 -
 140
140 -
 141
141 -
142
-
143
-
144
-
145
-
146
-
147
-
148
-
149
-
150
-
151
-
152
-
153
-
154
-
155
-
156
-
157
-
158
-
159
-
160
-
161
-
162
-
163
-
164
-
165
-
166
-
167
-
168
-
169
-
170
-
171
-
172
-
173
-
174
-
175
-
176
-
177
-
178
-
179
-
180
-
181
-
182
-
183
-
184
-
185
-
186
-
187
-
188
-
189
-
190
-
191
-
192
-
193
-
194
-
195
-
196
-
197
-
198
-
199
-
200
-
201
-
202
-
203
-
204
-
205
-
206
-
207
-
208
-
209
-
210
-
211
-
212
-
213
-
214
-
215
-
216
-
217
-
218
-
219
-
220
-
221
-
222
-
223
-
224
-
225
-
226
-
227
-
228
-
229
-
230
-
231
-
232
-
233
-
234
-
235
-
236
-
237
-
238
-
239
-
240
-
241
-
242
-
243
-
244
-
245
-
246
-
247
-
248
-
249
-
250
-
251
-
252
-
253
-
254
-
255
-
256
-
257
-
258
-
259
-
260
-
261
-
262
-
263
-
264
 |
 |

adidas Group
/
2013 Annual Report
Group Management Report – Financial Review
127
2013
/
03.2
/
Group Business Performance
/
Income Statement
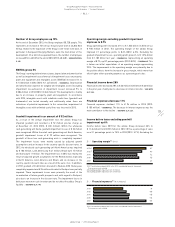
Other operating income increases
Other operating income includes items such as gains from the disposal
of fixed assets and releases of accruals and provisions as well as
insurance compensation. In 2013, other operating income increased
13% to € 143 million (2012: € 127 million)
/
SEE NOTE 29, P. 227. This was
mainly due to the release of other operational provisions
/
SEE NOTE 19,
P. 211.
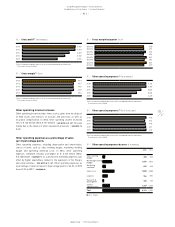
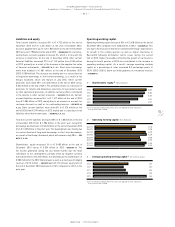
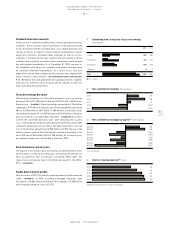
Other operating expenses as a percentage of sales
up 1.0 percentage points
Other operating expenses, including depreciation and amortisation,
consist of items such as sales working budget, marketing working
budget and operating overhead costs. In 2013, other operating
expenses remained virtually unchanged at € 6.133 billion (2012:
€ 6.150 billion)
/
DIAGRAM 17, as a decrease in marketing expenses was
offset by higher expenditure related to the expansion of the Group’s
own-retail activities
/
SEE NOTE 30, P. 227. Other operating expenses as
a percentage of sales increased 1.0 percentage points to 42.3% in 2013
from 41.3% in 2012
/
DIAGRAM 18.
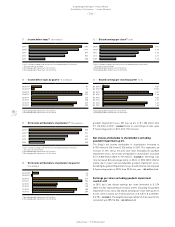
14
/
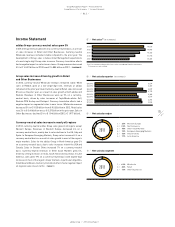
Gross profit 1) (€ in millions)
2013 7,140
2012 7,103
2011 6,329
2010 5,730
2009 4,712
1) 2011 restated according to IAS 8 in the 2012 consolidated financial statements.
Prior years are not restated.
15
/
Gross margin 1) (in %)
2013 49.3
2012 47.7
2011 47.5
2010 47.8
2009 45.4
1) 2011 restated according to IAS 8 in the 2012 consolidated financial statements.
Prior years are not restated.
17
/
Other operating expenses 1) (€ in millions)
2013 6,133
2012 6,150
2011 5,567
2010 5,046
2009 4,390
1) 2011 restated according to IAS 8 in the 2012 consolidated financial statements.
Prior years are not restated.
18
/
Other operating expenses 1) (in % of net sales)
2013 42.3
2012 41.3
2011 41.8
2010 42.1
2009 42.3
1) 2011 restated according to IAS 8 in the 2012 consolidated financial statements.
Prior years are not restated.
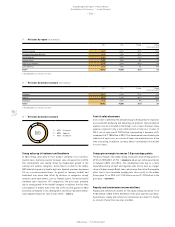
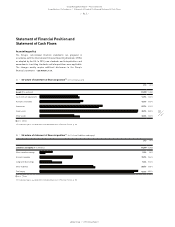
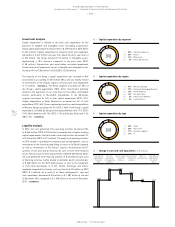
19
/
Other operating expenses by area (€ in millions)
2013 2012
Sales working
budget 340 304
Marketing working
budget 1,457 1,502
Marketing
overhead 425 445
Sales force 1,890 1,885
Logistics 766 750
Research &
development 128 128
Central
administration 1,127 1,136
Total 6,133 6,150
■ 2013 ■ 2012
16
/
Gross margin by quarter (in %)
Q4 2013 47.5
Q4 2012 47.6
Q3 2013 49.3
Q3 2012 47.4
Q2 2013 50.1
Q2 2012 48.2
Q1 2013 50.1
Q1 2012 47.7