Reebok 2013 Annual Report Download - page 138
Download and view the complete annual report
Please find page 138 of the 2013 Reebok annual report below. You can navigate through the pages in the report by either clicking on the pages listed below, or by using the keyword search tool below to find specific information within the annual report.-
 1
1 -
2
-
3
-
4
-
5
-
6
-
7
-
8
-
9
-
10
-
11
-
12
-
13
-
14
-
15
-
16
-
17
-
18
-
19
-
20
-
21
-
22
-
23
-
24
-
25
-
26
-
27
-
28
-
29
-
30
-
31
-
32
-
33
-
34
-
35
-
36
-
37
-
38
-
39
-
40
-
41
-
42
-
43
-
44
-
45
-
46
-
47
-
48
-
49
-
50
-
51
-
52
-
53
-
54
-
55
-
56
-
57
-
58
-
59
-
60
-
61
-
62
-
63
-
64
-
65
-
66
-
67
-
68
-
69
-
70
-
71
-
72
-
73
-
74
-
75
-
76
-
77
-
78
-
79
-
80
-
81
-
82
-
83
-
84
-
85
-
86
-
87
-
88
-
89
-
90
-
91
-
92
-
93
-
94
-
95
-
96
-
97
-
98
-
99
-
100
-
101
-
102
-
103
-
104
-
105
-
106
-
107
-
108
-
109
-
110
-
111
-
112
-
113
-
114
-
115
-
116
-
117
-
118
-
119
-
120
-
121
-
122
-
123
-
124
-
125
-
126
-
127
-
 128
128 -
 129
129 -
 130
130 -
 131
131 -
 132
132 -
 133
133 -
 134
134 -
 135
135 -
 136
136 -
 137
137 -
 138
138 -
 139
139 -
 140
140 -
 141
141 -
 142
142 -
 143
143 -
 144
144 -
 145
145 -
 146
146 -
 147
147 -
 148
148 -
149
-
150
-
151
-
152
-
153
-
154
-
155
-
156
-
157
-
158
-
159
-
160
-
161
-
162
-
163
-
164
-
165
-
166
-
167
-
168
-
169
-
170
-
171
-
172
-
173
-
174
-
175
-
176
-
177
-
178
-
179
-
180
-
181
-
182
-
183
-
184
-
185
-
186
-
187
-
188
-
189
-
190
-
191
-
192
-
193
-
194
-
195
-
196
-
197
-
198
-
199
-
200
-
201
-
202
-
203
-
204
-
205
-
206
-
207
-
208
-
209
-
210
-
211
-
212
-
213
-
214
-
215
-
216
-
217
-
218
-
219
-
220
-
221
-
222
-
223
-
224
-
225
-
226
-
227
-
228
-
229
-
230
-
231
-
232
-
233
-
234
-
235
-
236
-
237
-
238
-
239
-
240
-
241
-
242
-
243
-
244
-
245
-
246
-
247
-
248
-
249
-
250
-
251
-
252
-
253
-
254
-
255
-
256
-
257
-
258
-
259
-
260
-
261
-
262
-
263
-
264
 |
 |
adidas Group
/
2013 Annual Report
Group Management Report – Financial Review
134
2013
/
03.2
/
Group Business Performance
/
Statement of Financial Position and Statement of Cash Flows
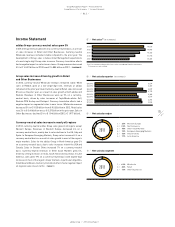
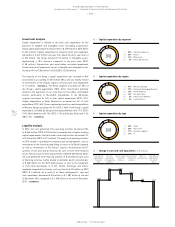
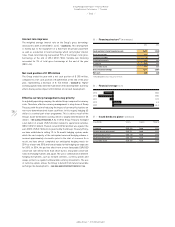
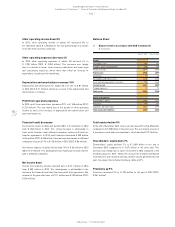
Investment analysis
Capital expenditure is defined as the total cash expenditure for the
purchase of tangible and intangible assets (excluding acquisitions).
Group capital expenditure increased 10% to € 479 million in 2013 (2012:
€ 434 million). Capital expenditure in property, plant and equipment
amounted to € 427 million and was thus above the prior year level of
€ 376 million. The Group invested € 52 million in intangible assets,
representing a 10% decrease compared to the prior year (2012:
€ 58 million). Depreciation and amortisation excluding impairment
losses/reversal of impairment losses of tangible and intangible assets
increased 9% to € 286 million in 2013 (2012: € 263 million).
The majority of the Group’s capital expenditure was recorded in HQ/
Consolidation, accounting for 52% (2012: 58%), and was mainly related
to investments in the Group’s logistics infrastructure and deployment
of IT systems
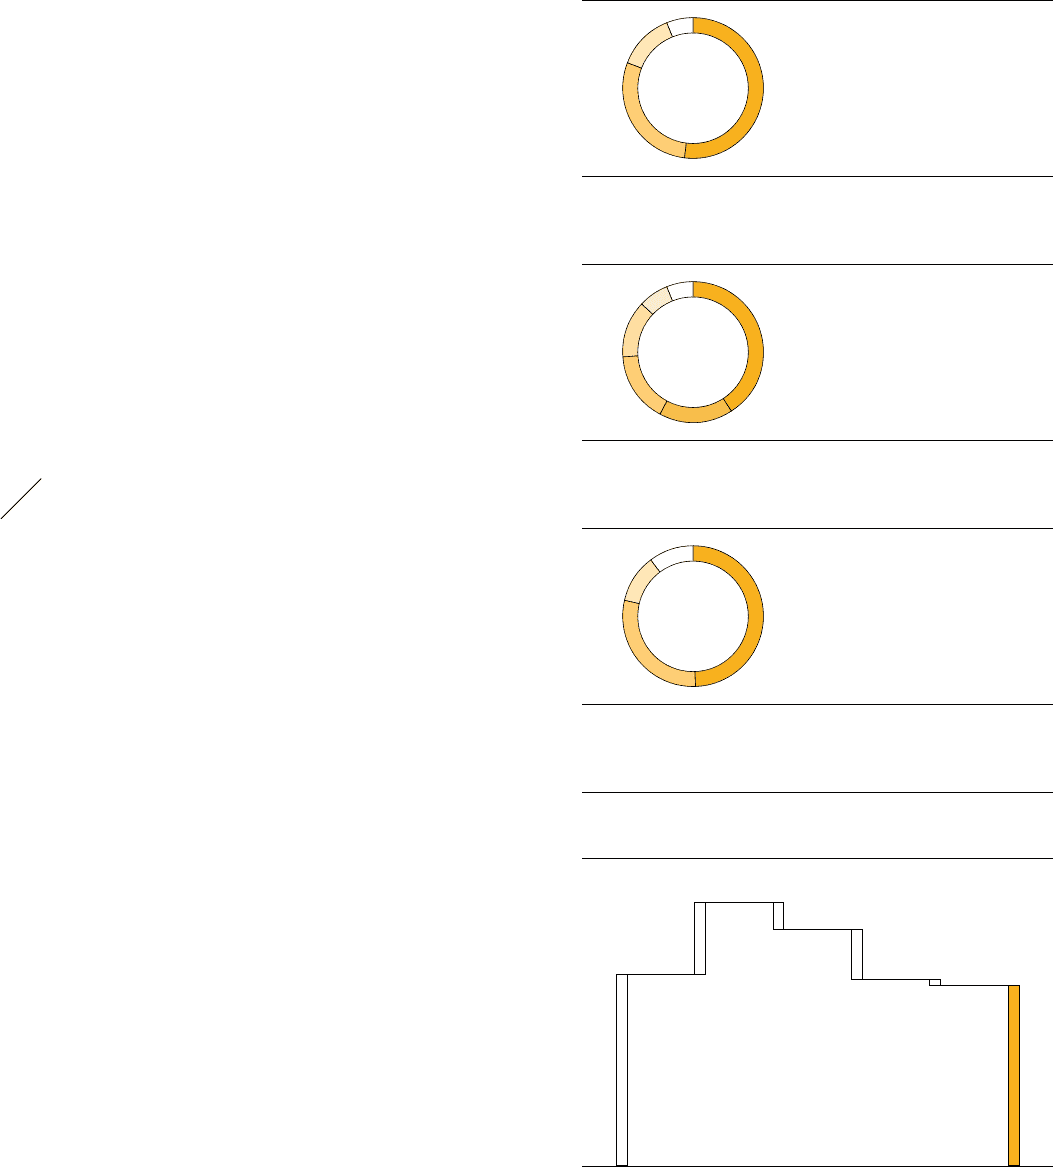
/
DIAGRAM 42. The Retail segment accounted for 29% of
the Group’s capital expenditure (2012: 24%). Investments primarily
related to the expansion of our store base for the adidas and Reebok
brands, particularly in Russia/CIS. Expenditure in the Wholesale
segment accounted for 13% of total capital expenditure (2012: 12%).
Capital expenditure in Other Businesses accounted for 6% of total
expenditure (2012: 6%). From a regional perspective, capital expenditure
in Western Europe accounted for 41% (2012: 45%) of the Group’s capital
expenditure, followed by European Emerging Markets with 17% (2012:
15%), North America with 16% (2012: 11%) and Greater China with 13%
(2012: 9%)
/
DIAGRAM 43.
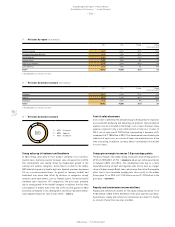
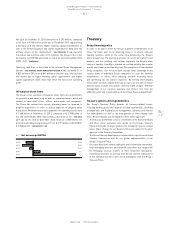
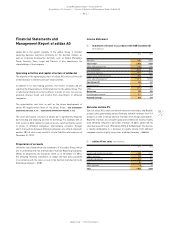
Liquidity analysis
In 2013, net cash generated from operating activities decreased 33%
to € 634 million (2012: € 942 million), primarily due to higher working
capital requirements. Net cash used in investing activities increased 12%
to € 243 million (2012: € 217 million). The majority of investing activities
in 2013 related to spending for property, plant and equipment, such as
investments in the furnishing and fitting of stores in our Retail segment
as well as investments in the Group’s logistics infrastructure and IT
systems. These were partly offset by the sale of short-term financial
assets. Net cash used in financing activities totalled € 439 million (2012:
net cash generated from financing activities of € 42 million). Cash used
in financing activities mainly related to dividends paid to shareholders
of € 282 million for the 2012 financial year as well as the repayment
of short-term borrowings of € 221 million. Exchange rate effects
negatively impacted the Group’s cash position by € 35 million in 2013
(2012: € 3 million). As a result of all these developments, cash and
cash equivalents decreased € 83 million to € 1.587 billion at the end
of December 2013 compared to € 1.670 billion at the end of December
2012
/
DIAGRAM 45.
42
/
Capital expenditure by segment
43
/
Capital expenditure by region
44
/
Capital expenditure by type
2013
2013
2013
1
/
52% HQ/Consolidation
2
/
29% Retail
3
/
13% Wholesale
4
/
6% Other Businesses
1
/
41% Western Europe
2
/
17% European Emerging Markets
3
/
16% North America
4
/
13% Greater China
5
/
7% Other Asian Markets
6
/
6% Latin America
1
/
49% Other
2
/
29% Own retail
3
/
11% Retailer support
4
/
11% IT
1
1
1
2
3
2
2
3
5
3
4
6
4
4
45
/
Change in cash and cash equivalents (€ in millions)
Cash and cash
equivalents at
the end of
2012
Net cash
generated
from operating
activities
Net cash used
in investing
activities
Net cash used
in financing
activities
Effect of
exchange rates
Cash and cash
equivalents at
the end of
2013
1,670
634 (243)
(35)
(439)
1,587