Reebok 2013 Annual Report Download - page 126
Download and view the complete annual report
Please find page 126 of the 2013 Reebok annual report below. You can navigate through the pages in the report by either clicking on the pages listed below, or by using the keyword search tool below to find specific information within the annual report.-
 1
1 -
2
-
3
-
4
-
5
-
6
-
7
-
8
-
9
-
10
-
11
-
12
-
13
-
14
-
15
-
16
-
17
-
18
-
19
-
20
-
21
-
22
-
23
-
24
-
25
-
26
-
27
-
28
-
29
-
30
-
31
-
32
-
33
-
34
-
35
-
36
-
37
-
38
-
39
-
40
-
41
-
42
-
43
-
44
-
45
-
46
-
47
-
48
-
49
-
50
-
51
-
52
-
53
-
54
-
55
-
56
-
57
-
58
-
59
-
60
-
61
-
62
-
63
-
64
-
65
-
66
-
67
-
68
-
69
-
70
-
71
-
72
-
73
-
74
-
75
-
76
-
77
-
78
-
79
-
80
-
81
-
82
-
83
-
84
-
85
-
86
-
87
-
88
-
89
-
90
-
91
-
92
-
93
-
94
-
95
-
96
-
97
-
98
-
99
-
100
-
101
-
102
-
103
-
104
-
105
-
106
-
107
-
108
-
109
-
110
-
111
-
112
-
113
-
114
-
115
-
 116
116 -
 117
117 -
 118
118 -
 119
119 -
 120
120 -
 121
121 -
 122
122 -
 123
123 -
 124
124 -
 125
125 -
 126
126 -
 127
127 -
 128
128 -
 129
129 -
 130
130 -
 131
131 -
 132
132 -
 133
133 -
 134
134 -
 135
135 -
 136
136 -
137
-
138
-
139
-
140
-
141
-
142
-
143
-
144
-
145
-
146
-
147
-
148
-
149
-
150
-
151
-
152
-
153
-
154
-
155
-
156
-
157
-
158
-
159
-
160
-
161
-
162
-
163
-
164
-
165
-
166
-
167
-
168
-
169
-
170
-
171
-
172
-
173
-
174
-
175
-
176
-
177
-
178
-
179
-
180
-
181
-
182
-
183
-
184
-
185
-
186
-
187
-
188
-
189
-
190
-
191
-
192
-
193
-
194
-
195
-
196
-
197
-
198
-
199
-
200
-
201
-
202
-
203
-
204
-
205
-
206
-
207
-
208
-
209
-
210
-
211
-
212
-
213
-
214
-
215
-
216
-
217
-
218
-
219
-
220
-
221
-
222
-
223
-
224
-
225
-
226
-
227
-
228
-
229
-
230
-
231
-
232
-
233
-
234
-
235
-
236
-
237
-
238
-
239
-
240
-
241
-
242
-
243
-
244
-
245
-
246
-
247
-
248
-
249
-
250
-
251
-
252
-
253
-
254
-
255
-
256
-
257
-
258
-
259
-
260
-
261
-
262
-
263
-
264
 |
 |
2
adidas Group
/
2013 Annual Report
Group Management Report – Financial Review
122
2013
/
03.2
/
Group Business Performance
/
Economic and Sector Development
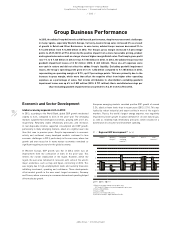
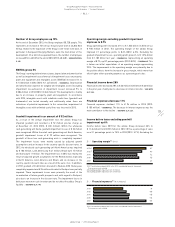
Group Business Performance
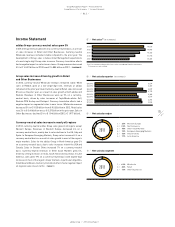
In 2013, the adidas Group delivered a solid financial performance, despite macroeconomic challenges
in many regions, especially Western Europe. Currency-neutral Group sales increased 3% as a result
of growth in Retail and Other Businesses. In euro terms, adidas Group revenues decreased 3% to
€ 14.492 billion from € 14.883 billion in 2012. The Group’s gross margin increased 1.5 percentage
points to 49.3% (2012: 47.7%), driven by the positive impact from a more favourable pricing, product
and regional sales mix as well as a larger share of higher-margin Retail sales. The Group’s gross profit
rose 1% to € 7.140 billion in 2013 versus € 7.103 billion in 2012. In 2013, the adidas Group incurred
goodwill impairment losses of € 52 million (2012: € 265 million). These one-off expenses were
non-cash in nature and did not affect the adidas Group’s liquidity. Excluding goodwill impairment
losses, the Group’s operating profit grew 6% to € 1.254 billion compared to € 1.185 billion in 2012,
representing an operating margin of 8.7%, up 0.7 percentage points. This was primarily due to the
increase in gross margin, which more than offset the negative effect from higher other operating
expenses as a percentage of sales. Net income attributable to shareholders excluding goodwill
impairment losses was up 6% to € 839 million (2012: € 791 million). Basic and diluted earnings per
share excluding goodwill impairment losses grew 6% to € 4.01 from € 3.78 in 2012.
Economic and Sector Development
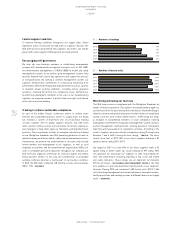
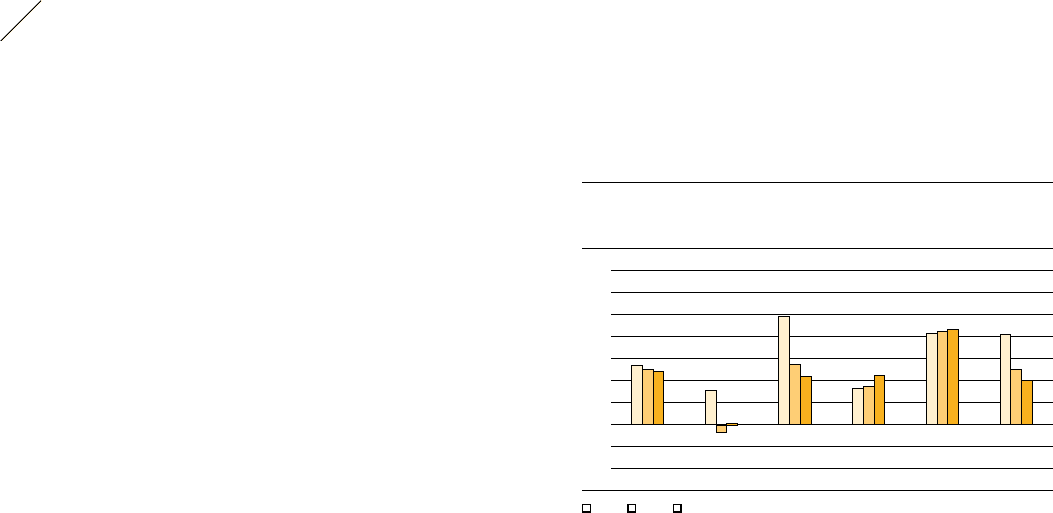
Global economy expands 2.4% in 2013
In 2013, according to the World Bank, global GDP growth moderated
slightly to 2.4%, compared to 2.5% in the prior year. The emerging
markets outperformed developed economies, growing 4.8% and 1.3%,
respectively. Relatively stable inflationary pressures and increases
in real disposable incomes supported consumption and GDP growth,
particularly in many emerging markets, albeit at a slightly lower rate
than that seen in previous years. Despite improvements in economic
activity and sentiment, many developed markets continued to face
economic challenges in 2013, particularly in the euro area, where low
growth and even recession in many mature economies remained as
significant negative pressure for the global economy.
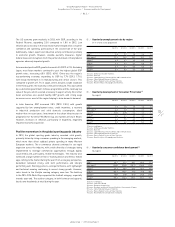
In Western Europe, GDP growth was flat in 2013, which was an
improvement from the contraction of 0.3% in the prior year. This
reflects the overall stabilisation of the region. However, within the
region, the euro area remained in recession, with some of the union’s
major economies, such as Italy and Spain, contracting in 2013. This
was largely due to high unemployment levels and austerity measures
inhibiting investment, spending and confidence. These developments
offset modest growth in the euro area’s largest economies, Germany
and France, where a recovery in consumer demand and spending helped
drive moderate growth.
European emerging markets recorded positive GDP growth of around
2.2%, albeit at lower levels than in recent years (2012: 2.7%). This was
fuelled by robust industrial and export activity in most of the region’s
markets. Russia, the world’s largest energy exporter, was negatively
impacted by lower growth in global demand for oil and natural gas,
as well as relatively high inflationary pressures which resulted in a
deceleration in consumer and investment spending.
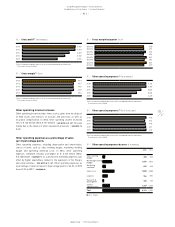
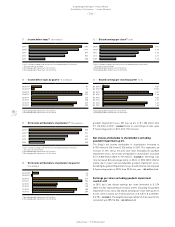
01
/
Regional GDP development 1) (in %)
Global 2) Western
Europe 3)
European
emerging
markets 3)
USA 4) Asia 3) 5) Latin
America 3)
6
4
2
0
(2)
■ 2011 ■ 2012 ■ 2013
1) Real, percentage change versus prior year;
2011 and 2012 figures restated compared to prior year.
2) Source: World Bank.
3) Source: HSBC.
4) Source: U.S. Federal Reserve.
5) Asia also includes Japan and Area Pacific.