Reebok 2013 Annual Report Download - page 239
Download and view the complete annual report
Please find page 239 of the 2013 Reebok annual report below. You can navigate through the pages in the report by either clicking on the pages listed below, or by using the keyword search tool below to find specific information within the annual report.-
 1
1 -
2
-
3
-
4
-
5
-
6
-
7
-
8
-
9
-
10
-
11
-
12
-
13
-
14
-
15
-
16
-
17
-
18
-
19
-
20
-
21
-
22
-
23
-
24
-
25
-
26
-
27
-
28
-
29
-
30
-
31
-
32
-
33
-
34
-
35
-
36
-
37
-
38
-
39
-
40
-
41
-
42
-
43
-
44
-
45
-
46
-
47
-
48
-
49
-
50
-
51
-
52
-
53
-
54
-
55
-
56
-
57
-
58
-
59
-
60
-
61
-
62
-
63
-
64
-
65
-
66
-
67
-
68
-
69
-
70
-
71
-
72
-
73
-
74
-
75
-
76
-
77
-
78
-
79
-
80
-
81
-
82
-
83
-
84
-
85
-
86
-
87
-
88
-
89
-
90
-
91
-
92
-
93
-
94
-
95
-
96
-
97
-
98
-
99
-
100
-
101
-
102
-
103
-
104
-
105
-
106
-
107
-
108
-
109
-
110
-
111
-
112
-
113
-
114
-
115
-
116
-
117
-
118
-
119
-
120
-
121
-
122
-
123
-
124
-
125
-
126
-
127
-
128
-
129
-
130
-
131
-
132
-
133
-
134
-
135
-
136
-
137
-
138
-
139
-
140
-
141
-
142
-
143
-
144
-
145
-
146
-
147
-
148
-
149
-
150
-
151
-
152
-
153
-
154
-
155
-
156
-
157
-
158
-
159
-
160
-
161
-
162
-
163
-
164
-
165
-
166
-
167
-
168
-
169
-
170
-
171
-
172
-
173
-
174
-
175
-
176
-
177
-
178
-
179
-
180
-
181
-
182
-
183
-
184
-
185
-
186
-
187
-
188
-
189
-
190
-
191
-
192
-
193
-
194
-
195
-
196
-
197
-
198
-
199
-
200
-
201
-
202
-
203
-
204
-
205
-
206
-
207
-
208
-
209
-
210
-
211
-
212
-
213
-
214
-
215
-
216
-
217
-
218
-
219
-
220
-
221
-
222
-
223
-
224
-
225
-
226
-
227
-
228
-
 229
229 -
 230
230 -
 231
231 -
 232
232 -
 233
233 -
 234
234 -
 235
235 -
 236
236 -
 237
237 -
 238
238 -
 239
239 -
 240
240 -
 241
241 -
 242
242 -
 243
243 -
 244
244 -
 245
245 -
 246
246 -
 247
247 -
 248
248 -
 249
249 -
250
-
251
-
252
-
253
-
254
-
255
-
256
-
257
-
258
-
259
-
260
-
261
-
262
-
263
-
264
 |
 |
adidas Group
/
2013 Annual Report
Consolidated Financial Statements
235
2013
/
04.8
/
Notes
/
Notes – Additional Information
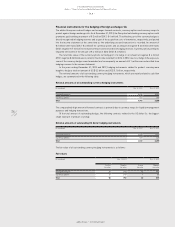
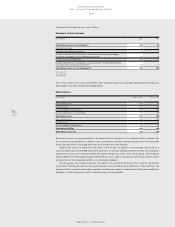
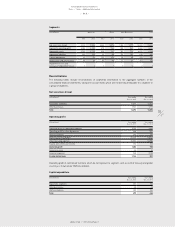
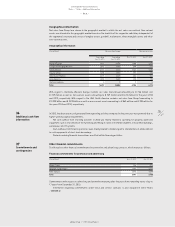
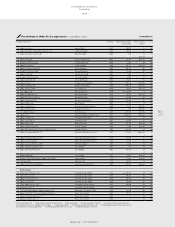
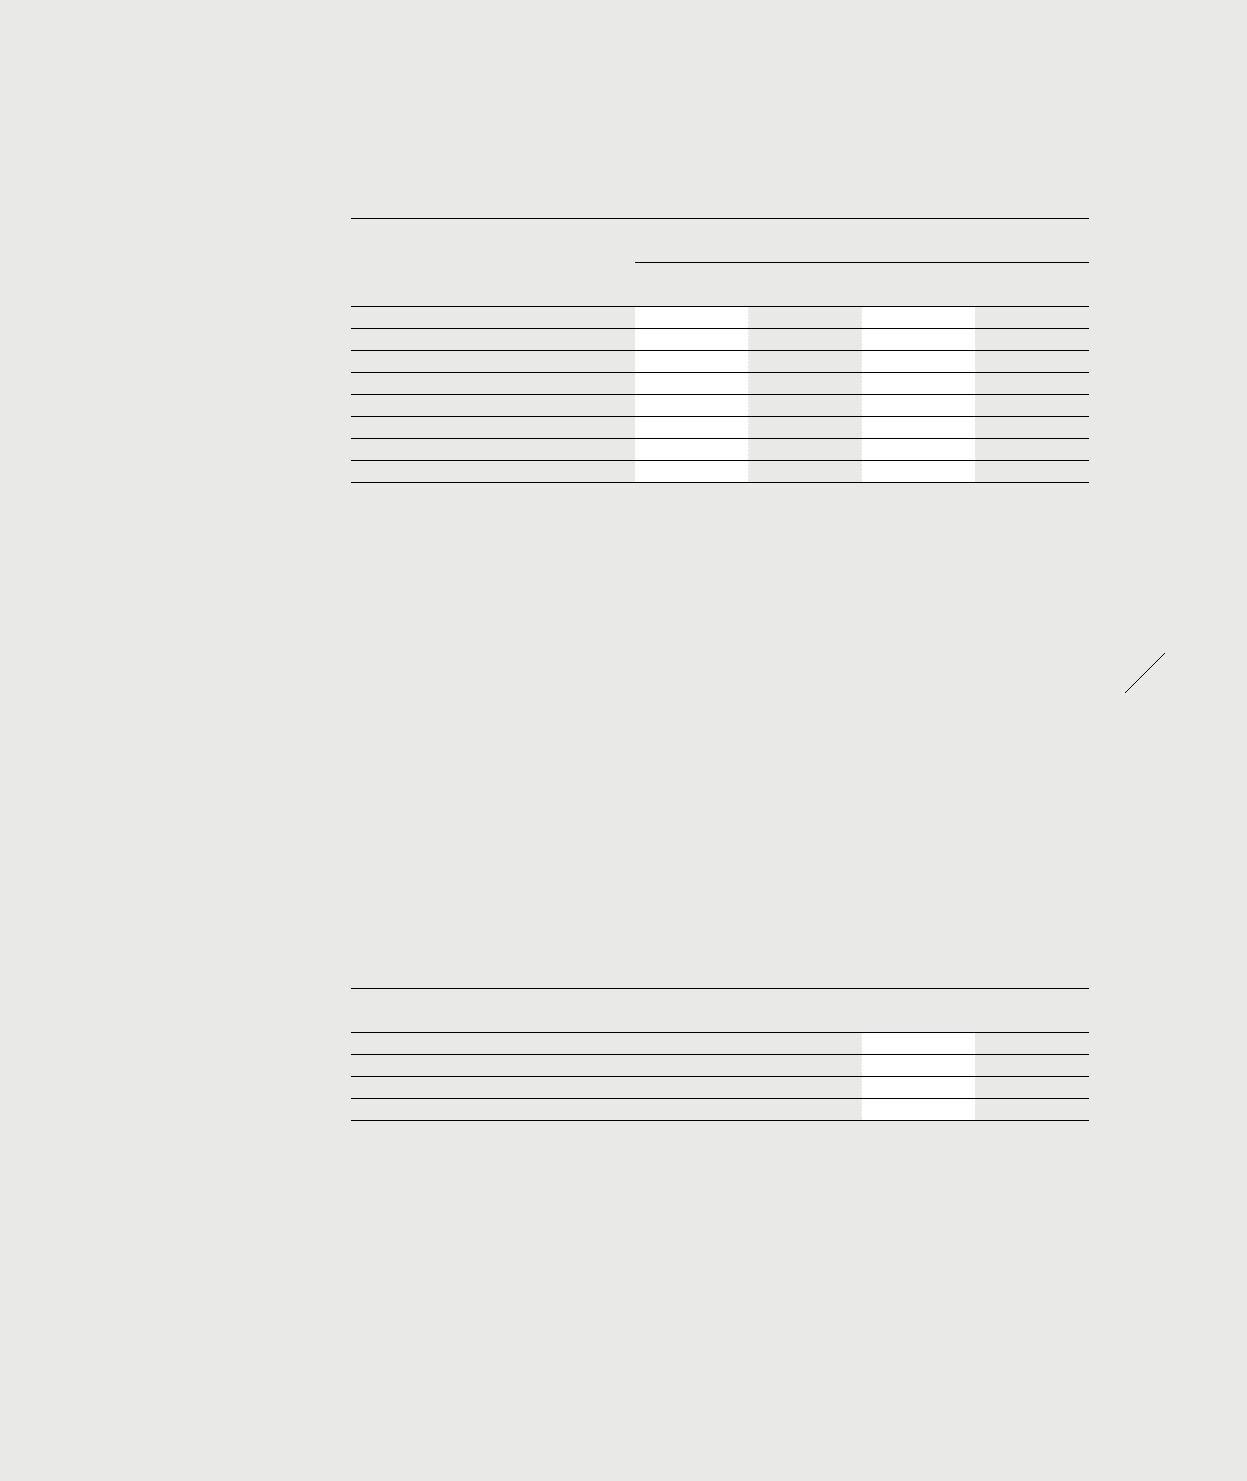
Geographical information
Net sales (non-Group) are shown in the geographic market in which the net sales are realised. Non-current
assets are allocated to the geographic market based on the domicile of the respective subsidiary independent of
the segmental structure and consist of tangible assets, goodwill, trademarks, other intangible assets and other
non-current assets.
Geographical information
(€ in millions) Net sales (non-Group) Non-current assets
Year ending
Dec. 31, 2013
Year ending
Dec. 31, 2012
Dec. 31, 2013 Dec. 31, 2012
Western Europe 3,800 4,076 1,488 1,449
European Emerging Markets 1,894 1,947 608 599
North America 3,362 3,410 1,023 1,080
Greater China 1,655 1,562 296 274
Other Asian Markets 2,206 2,407 483 536
Latin America 1,575 1,481 208 175
HQ/Consolidation 0 0 0 0
Total 14,492 14,883 4,106 4,113
With regard to Germany, Western Europe contains net sales (non-Group) amounting to € 726 million and
€ 739 million as well as non-current assets amounting to € 739 million and € 673 million for the years 2013
and 2012, respectively. With regard to the USA, North America contains net sales (non-Group) amounting to
€ 2.920 billion and € 2.978 billion as well as non-current assets amounting to € 862 million and € 928 million for
the years 2013 and 2012, respectively.
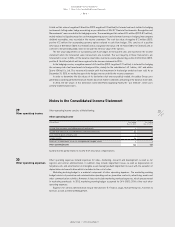
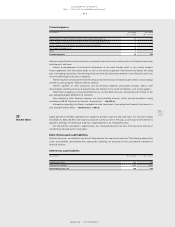
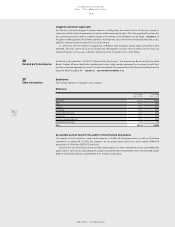
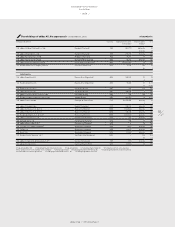
In 2013, the decrease in cash generated from operating activities compared to the prior year was primarily due to
higher working capital requirements.
Net cash outflow from investing activities in 2013 was mainly related to spending for property, plant and
equipment such as investments in the furnishing and fitting of stores in the Retail segment, in new office buildings,
warehouses and IT systems.
Cash outflows from financing activities were mainly related to dividend paid to shareholders of adidas AG and
to cash repayments of short-term borrowings.
Current revolving financial transactions are offset within financing activities.
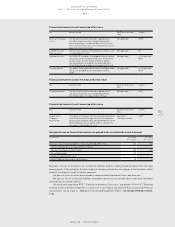
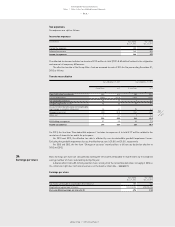
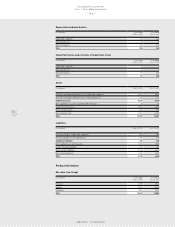
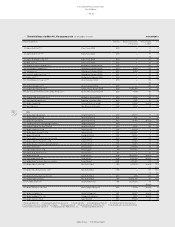
Other financial commitments
The Group has other financial commitments for promotion and advertising contracts, which mature as follows:
Financial commitments for promotion and advertising
(€ in millions) Dec. 31, 2013 Dec. 31, 2012
Within 1 year 724 679
Between 1 and 5 years 2,054 1,991
After 5 years 1,013 1,098
Total 3,791 3,768
Commitments with respect to advertising and promotion maturing after five years have remaining terms of up to
17 years from December 31, 2013.
Information regarding commitments under lease and service contracts is also included in these Notes
/
SEE NOTE 27.
36
Additional cash flow
information
37
Commitments and
contingencies