Reebok 2013 Annual Report Download - page 177
Download and view the complete annual report
Please find page 177 of the 2013 Reebok annual report below. You can navigate through the pages in the report by either clicking on the pages listed below, or by using the keyword search tool below to find specific information within the annual report.-
 1
1 -
2
-
3
-
4
-
5
-
6
-
7
-
8
-
9
-
10
-
11
-
12
-
13
-
14
-
15
-
16
-
17
-
18
-
19
-
20
-
21
-
22
-
23
-
24
-
25
-
26
-
27
-
28
-
29
-
30
-
31
-
32
-
33
-
34
-
35
-
36
-
37
-
38
-
39
-
40
-
41
-
42
-
43
-
44
-
45
-
46
-
47
-
48
-
49
-
50
-
51
-
52
-
53
-
54
-
55
-
56
-
57
-
58
-
59
-
60
-
61
-
62
-
63
-
64
-
65
-
66
-
67
-
68
-
69
-
70
-
71
-
72
-
73
-
74
-
75
-
76
-
77
-
78
-
79
-
80
-
81
-
82
-
83
-
84
-
85
-
86
-
87
-
88
-
89
-
90
-
91
-
92
-
93
-
94
-
95
-
96
-
97
-
98
-
99
-
100
-
101
-
102
-
103
-
104
-
105
-
106
-
107
-
108
-
109
-
110
-
111
-
112
-
113
-
114
-
115
-
116
-
117
-
118
-
119
-
120
-
121
-
122
-
123
-
124
-
125
-
126
-
127
-
128
-
129
-
130
-
131
-
132
-
133
-
134
-
135
-
136
-
137
-
138
-
139
-
140
-
141
-
142
-
143
-
144
-
145
-
146
-
147
-
148
-
149
-
150
-
151
-
152
-
153
-
154
-
155
-
156
-
157
-
158
-
159
-
160
-
161
-
162
-
163
-
164
-
165
-
166
-
 167
167 -
 168
168 -
 169
169 -
 170
170 -
 171
171 -
 172
172 -
 173
173 -
 174
174 -
 175
175 -
 176
176 -
 177
177 -
 178
178 -
 179
179 -
 180
180 -
 181
181 -
 182
182 -
 183
183 -
 184
184 -
 185
185 -
 186
186 -
 187
187 -
188
-
189
-
190
-
191
-
192
-
193
-
194
-
195
-
196
-
197
-
198
-
199
-
200
-
201
-
202
-
203
-
204
-
205
-
206
-
207
-
208
-
209
-
210
-
211
-
212
-
213
-
214
-
215
-
216
-
217
-
218
-
219
-
220
-
221
-
222
-
223
-
224
-
225
-
226
-
227
-
228
-
229
-
230
-
231
-
232
-
233
-
234
-
235
-
236
-
237
-
238
-
239
-
240
-
241
-
242
-
243
-
244
-
245
-
246
-
247
-
248
-
249
-
250
-
251
-
252
-
253
-
254
-
255
-
256
-
257
-
258
-
259
-
260
-
261
-
262
-
263
-
264
 |
 |
adidas Group
/
2013 Annual Report
Group Management Report – Financial Review
173
2013
/
03.5
/
Risk and Opportunity Report
/
Financial Risks
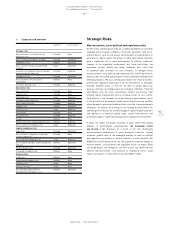
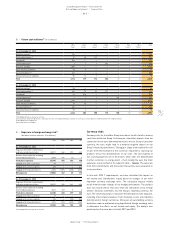
Currency risks
Currency risks for the adidas Group are a direct result of multi-currency
cash flows within the Group. Furthermore, translation impacts from the
conversion of non-euro-denominated results into our Group’s functional
currency, the euro, might lead to a material negative impact on our
Group’s financial performance. The biggest single driver behind this risk
results from the mismatch of the currencies required for sourcing our
products versus the denominations of our sales. The vast majority of
our sourcing expenses are in US dollars, while sales are denominated
in other currencies to a large extent – most notably the euro. Our main
exposures are presented in the adjacent table
/
TABLE 06. The exposure
from firm commitments and forecasted transactions was calculated on
a one-year basis.
In line with IFRS 7 requirements, we have calculated the impact on
net income and shareholders’ equity based on changes in our most
important currency exchange rates. The calculated impacts mainly
result from fair value changes of our hedging instruments. The analysis
does not include effects that arise from the translation of our foreign
entities’ financial statements into the Group’s reporting currency, the
euro. The sensitivity analysis is based on the net balance sheet exposure,
including intercompany balances from monetary assets and liabilities
denominated in foreign currencies. Moreover, all outstanding currency
derivatives were re-evaluated using hypothetical foreign exchange rates
to determine the effects on net income and equity. The analysis was
performed on the same basis for both 2012 and 2013.
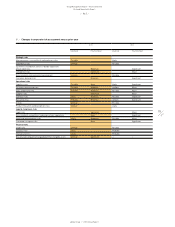
05
/
Future cash outflows 1) (€ in millions)
Up to
1 year
Up to
2 years
Up to
3 years
Up to
4 years
Up to
5 years
Up to
6 years
Up to
7 years
Total
As at December 31, 2013
Bank borrowings 2) 126 — — — — — — 126
Private placements 3) 70 95 111 — — — — 276
Eurobond 3) 514 — — — — — — 514
Convertible bond 3) 1 1 1 502 — — — 505
Accounts payable 1,825 ——————1,825
Other financial liabilities 33 9 — — — — — 42
Accrued liabilities 4) 464 — — — — — — 464
Derivative financial liabilities 80 12 1 — — — — 93
Total 3,113 117 113 502 — — — 3,845
As at December 31, 2012
Bank borrowings 2) 59 — — — — — — 59
Private placements 3) 242 70 99 117 — — — 528
Eurobond 3) 24 514 — — — — — 538
Convertible bond 3) 1 1 1 1 503 — — 507
Accounts payable 1,790 — — — — — — 1,790
Other financial liabilities 26 14 — — — — — 40
Accrued liabilities 4) 434 — — — — — — 434
Derivative financial liabilities 57 3 — — — — — 60
Total 2,633 602 100 118 503 — — 3,956
1) Rounding difference may arise in totals.
2) Classified as long-term (between 1 and 3 years) in the consolidated financial statements, as they are covered by the committed mid-term syndicated loan.
3) Including interest payments.
4) Accrued interest excluded.
06
/
Exposure to foreign exchange risk 1)
(based on notional amounts, € in millions)
USD RUB GBP JPY
As at December 31, 2013
Exposure from firm commitments
and forecasted transactions (3,811) 348 370 362
Balance sheet exposure including
intercompany exposure (358) 106 (7) 6
Total gross exposure (4,169) 454 363 368
Hedged with other cash flows 87 — — —
Hedged with currency options 425 — — (47)
Hedged with forward contracts 2,604 (107) (298) (209)
Net exposure (1,053) 347 65 112
As at December 31, 2012
Exposure from firm commitments
and forecasted transactions (3,819) 359 369 354
Balance sheet exposure including
intercompany exposure (321) 109 8 8
Total gross exposure (4,140) 468 377 362
Hedged with other cash flows 91 — — —
Hedged with currency options 225 — (12) (24)
Hedged with forward contracts 2101 (72) (263) (188)
Net exposure (1,723) 396 102 150
1) Rounding difference may arise in totals.