Reebok 2013 Annual Report Download - page 184
Download and view the complete annual report
Please find page 184 of the 2013 Reebok annual report below. You can navigate through the pages in the report by either clicking on the pages listed below, or by using the keyword search tool below to find specific information within the annual report.-
 1
1 -
2
-
3
-
4
-
5
-
6
-
7
-
8
-
9
-
10
-
11
-
12
-
13
-
14
-
15
-
16
-
17
-
18
-
19
-
20
-
21
-
22
-
23
-
24
-
25
-
26
-
27
-
28
-
29
-
30
-
31
-
32
-
33
-
34
-
35
-
36
-
37
-
38
-
39
-
40
-
41
-
42
-
43
-
44
-
45
-
46
-
47
-
48
-
49
-
50
-
51
-
52
-
53
-
54
-
55
-
56
-
57
-
58
-
59
-
60
-
61
-
62
-
63
-
64
-
65
-
66
-
67
-
68
-
69
-
70
-
71
-
72
-
73
-
74
-
75
-
76
-
77
-
78
-
79
-
80
-
81
-
82
-
83
-
84
-
85
-
86
-
87
-
88
-
89
-
90
-
91
-
92
-
93
-
94
-
95
-
96
-
97
-
98
-
99
-
100
-
101
-
102
-
103
-
104
-
105
-
106
-
107
-
108
-
109
-
110
-
111
-
112
-
113
-
114
-
115
-
116
-
117
-
118
-
119
-
120
-
121
-
122
-
123
-
124
-
125
-
126
-
127
-
128
-
129
-
130
-
131
-
132
-
133
-
134
-
135
-
136
-
137
-
138
-
139
-
140
-
141
-
142
-
143
-
144
-
145
-
146
-
147
-
148
-
149
-
150
-
151
-
152
-
153
-
154
-
155
-
156
-
157
-
158
-
159
-
160
-
161
-
162
-
163
-
164
-
165
-
166
-
167
-
168
-
169
-
170
-
171
-
172
-
173
-
 174
174 -
 175
175 -
 176
176 -
 177
177 -
 178
178 -
 179
179 -
 180
180 -
 181
181 -
 182
182 -
 183
183 -
 184
184 -
 185
185 -
 186
186 -
 187
187 -
 188
188 -
 189
189 -
 190
190 -
 191
191 -
 192
192 -
 193
193 -
 194
194 -
195
-
196
-
197
-
198
-
199
-
200
-
201
-
202
-
203
-
204
-
205
-
206
-
207
-
208
-
209
-
210
-
211
-
212
-
213
-
214
-
215
-
216
-
217
-
218
-
219
-
220
-
221
-
222
-
223
-
224
-
225
-
226
-
227
-
228
-
229
-
230
-
231
-
232
-
233
-
234
-
235
-
236
-
237
-
238
-
239
-
240
-
241
-
242
-
243
-
244
-
245
-
246
-
247
-
248
-
249
-
250
-
251
-
252
-
253
-
254
-
255
-
256
-
257
-
258
-
259
-
260
-
261
-
262
-
263
-
264
 |
 |

6
adidas Group
/
2013 Annual Report
Group Management Report – Financial Review
180
2013
Management Assessment of Performance, Risks and Opportunities, and Outlook
/
03.6
/
Management Assessment of
Performance, Risks and Opportunities,
and Outlook
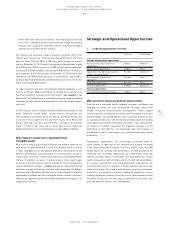
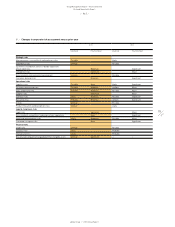
Assessment of performance versus targets
We communicate our Group’s financial targets on an annual basis. We
also provide updates throughout the year as appropriate
/
TABLE 01. In
2013, the adidas Group delivered a solid financial performance, despite
macroeconomic challenges in many regions, with currency-neutral
Group sales growth outperforming macroeconomic growth
/
SEE
ECONOMIC AND SECTOR DEVELOPMENT, P. 122.
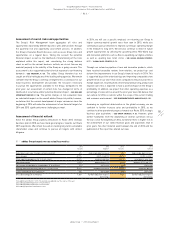
As a result of intensified currency translation headwinds, distribution
constraints due to a warehouse issue and a softer consumer
environment in Russia/CIS as well as an overall weakness in the golf
market, we lowered our full year 2013 guidance in September, compared
to our initial expectations.
In 2013, Group revenues rose 3% on a currency-neutral basis, mainly due
to growth in emerging markets as well as the further expansion of our
own-retail activities. Group revenues increased below our initial guidance
of a mid-single-digit currency-neutral increase. This was driven by lower
sales growth than originally expected in Russia/CIS and at TaylorMade-
adidas Golf. Gross margin increased 1.5 percentage points to 49.3%,
above our initial expectations of 48.0% to 48.5%. This development was
due to a more favourable pricing, product and regional sales mix as well
as strong improvements in the Reebok brand gross margin. Operating
margin excluding goodwill impairment losses improved 0.7 percentage
points to 8.7%. This development was slightly below our initial guidance
of approaching 9.0%, as operating expenses as a percentage of sales
were higher than originally forecasted. This was mainly due to the lower
top-line growth as well as the faster expansion of own-retail activities
than originally planned. As a result, basic and diluted earnings per share
excluding goodwill impairment losses were € 4.01 and thus below our
initial guidance of € 4.25 to € 4.40. This result was mainly due to negative
currency translation effects, which significantly impacted our reported
results in 2013, as well as the lower sales growth in Russia/CIS and at
TaylorMade-adidas Golf
/
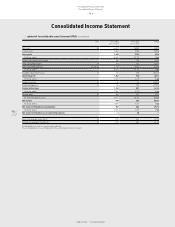
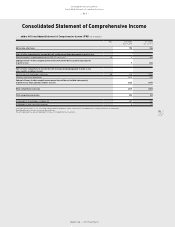
SEE INCOME STATEMENT, P. 125.
In 2013, operating working capital and cash management were negatively
impacted by increased working capital requirements towards the end of
the year. While we had expected average operating working capital as
a percentage of sales to increase moderately in 2013, our challenges
in Russia/CIS resulted in slightly higher inventories and, as a result,
a stronger increase than we had initially expected
/
SEE STATEMENT OF
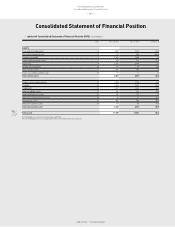
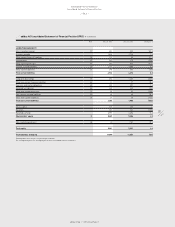
FINANCIAL POSITION AND STATEMENT OF CASH FLOWS, P. 131.
Beyond our financial performance, we also actively monitor the Group’s
key non-financial KPIs on a regular basis, as available
/
SEE INTERNAL
GROUP MANAGEMENT SYSTEM, P. 118. From a market share perspective, we
continue to be very encouraged by our strong performance compared to
our major competitors in key emerging markets. In particular, Greater
China and Latin America were notable standouts, as we significantly
improved our market share in both regions in 2013. Less pleasing,
however, was our underperformance in key developed markets such
as the USA and Western Europe. Nevertheless, in these markets, we
have seen signs of improvement towards the end of 2013, driven by
product launches in key categories such as football and running. Finally
in the golf market, despite a challenging year for the entire industry,
we continue to enjoy healthy market share positions. In metalwoods,
our market shares remain well above 30% in the USA and Western
Europe, slightly lower than the prior year. In both irons and footwear, we
increased market share in nearly all key regions in 2013.
Despite the distribution challenges we faced in Russia/CIS, we continued
to maintain a good level of on-time in-full deliveries to our customers
and own-retail stores in 2013
/
SEE GLOBAL OPERATIONS, P. 94. As in
prior years, the majority of our sales in 2013 were again generated
from products launched in the past 12 to 18 months. In addition, we
received several awards and industry recognitions for our new product
innovations
/
SEE RESEARCH AND DEVELOPMENT, P. 99. At a Group level, we
also completed our most comprehensive employee engagement survey
during 2013. The result was satisfactorily on average with the benchmark
of our external provider, with improvements in several areas since our
last survey in 2010
/
SEE EMPLOYEES, P. 105. Finally, our diligence and
discipline in sustainability matters continues to yield strong recognition
for our Group. For the 14th consecutive time, we were selected to join
the Dow Jones Sustainability Indexes (DJSI) and were named industry
leader in sustainability issues and corporate responsibility in the
category “Clothing, Accessories & Footwear” for the tenth time
/
SEE
SUSTAINABILITY, P. 111.