Reebok 2013 Annual Report Download - page 143
Download and view the complete annual report
Please find page 143 of the 2013 Reebok annual report below. You can navigate through the pages in the report by either clicking on the pages listed below, or by using the keyword search tool below to find specific information within the annual report.-
 1
1 -
2
-
3
-
4
-
5
-
6
-
7
-
8
-
9
-
10
-
11
-
12
-
13
-
14
-
15
-
16
-
17
-
18
-
19
-
20
-
21
-
22
-
23
-
24
-
25
-
26
-
27
-
28
-
29
-
30
-
31
-
32
-
33
-
34
-
35
-
36
-
37
-
38
-
39
-
40
-
41
-
42
-
43
-
44
-
45
-
46
-
47
-
48
-
49
-
50
-
51
-
52
-
53
-
54
-
55
-
56
-
57
-
58
-
59
-
60
-
61
-
62
-
63
-
64
-
65
-
66
-
67
-
68
-
69
-
70
-
71
-
72
-
73
-
74
-
75
-
76
-
77
-
78
-
79
-
80
-
81
-
82
-
83
-
84
-
85
-
86
-
87
-
88
-
89
-
90
-
91
-
92
-
93
-
94
-
95
-
96
-
97
-
98
-
99
-
100
-
101
-
102
-
103
-
104
-
105
-
106
-
107
-
108
-
109
-
110
-
111
-
112
-
113
-
114
-
115
-
116
-
117
-
118
-
119
-
120
-
121
-
122
-
123
-
124
-
125
-
126
-
127
-
128
-
129
-
130
-
131
-
132
-
 133
133 -
 134
134 -
 135
135 -
 136
136 -
 137
137 -
 138
138 -
 139
139 -
 140
140 -
 141
141 -
 142
142 -
 143
143 -
 144
144 -
 145
145 -
 146
146 -
 147
147 -
 148
148 -
 149
149 -
 150
150 -
 151
151 -
 152
152 -
 153
153 -
154
-
155
-
156
-
157
-
158
-
159
-
160
-
161
-
162
-
163
-
164
-
165
-
166
-
167
-
168
-
169
-
170
-
171
-
172
-
173
-
174
-
175
-
176
-
177
-
178
-
179
-
180
-
181
-
182
-
183
-
184
-
185
-
186
-
187
-
188
-
189
-
190
-
191
-
192
-
193
-
194
-
195
-
196
-
197
-
198
-
199
-
200
-
201
-
202
-
203
-
204
-
205
-
206
-
207
-
208
-
209
-
210
-
211
-
212
-
213
-
214
-
215
-
216
-
217
-
218
-
219
-
220
-
221
-
222
-
223
-
224
-
225
-
226
-
227
-
228
-
229
-
230
-
231
-
232
-
233
-
234
-
235
-
236
-
237
-
238
-
239
-
240
-
241
-
242
-
243
-
244
-
245
-
246
-
247
-
248
-
249
-
250
-
251
-
252
-
253
-
254
-
255
-
256
-
257
-
258
-
259
-
260
-
261
-
262
-
263
-
264
 |
 |
adidas Group
/
2013 Annual Report
Group Management Report – Financial Review
139
2013
/
03.2
/
Group Business Performance
/
Financial Statements and Management Report of adidas AG
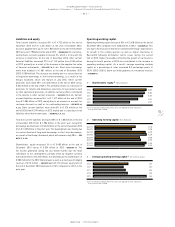
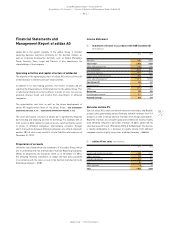
Income Statement
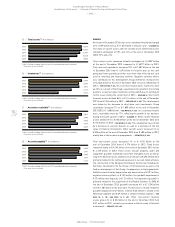
Net sales decline 2%
Sales of adidas AG comprise external revenues from adidas and Reebok
product sales generated by adidas Germany, external revenues from Y-3
products as well as Group-internal revenues from foreign subsidiaries.
Reported revenues also include royalty and commission income, mainly
from affiliated companies, and other revenues. In 2013, adidas AG net
sales decreased 2% to € 1.954 billion (2012: € 2.004 billion). This decline
is mainly attributable to a decrease in royalty income from affiliated
companies and to slightly lower sales at adidas Germany
/
TABLE 59.
58
/
Statement of income in accordance with HGB (Condensed)
(€ in millions)
2013 2012
Net sales 1,954 2,004
Total output 1,954 2,004
Other operating income 1,165 1,270
Cost of materials (532) (574)
Personnel expenses (357) (343)
Depreciation and amortisation (81) (71)
Other operating expenses (1,981) (2,055)
Operating profit 168 231
Financial result 43 350
Taxes (111) (77)
Net income 100 504
Profit brought forward 324 103
Retained earnings 424 607
Financial Statements and
Management Report of adidas AG
adidas AG is the parent company of the adidas Group. It includes
operating business functions, primarily for the German market, as
well as corporate headquarter functions such as Global Marketing,
Group Treasury, Taxes, Legal and Finance. It also administers the
shareholdings of the company.
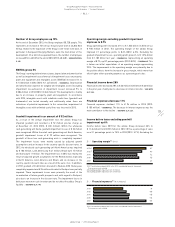
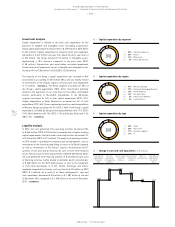
Operating activities and capital structure of adidas AG
The majority of the operating business of adidas AG consists of the sale
of merchandise to retailers and own-retail activities.
In addition to its own trading activities, the results of adidas AG are
significantly influenced by its holding function for the adidas Group. This
is reflected primarily in currency effects, transfer of costs for services
provided, interest result and income from investments in affiliated
companies.
The opportunities and risks as well as the future development of
adidas AG largely reflect those of the adidas Group
/
SEE SUBSEQUENT
EVENTS AND OUTLOOK, P. 151
/
SEE RISK AND OPPORTUNITY REPORT, P. 158.
The asset and capital structure of adidas AG is significantly impacted
by its holding and financing function for the Group. For example, 52% of
total assets in 2013 related to financial assets, which primarily consist
of shares in affiliated companies. Intercompany accounts, through
which transactions between affiliated companies are settled, represent
another 28% of total assets and 45% of total liabilities and equity as at
December 31, 2013.
Preparation of accounts
Unlike the consolidated financial statements of the adidas Group, which
are in conformity with the International Financial Reporting Standards
(IFRS), as adopted by the European Union as at December 31, 2013,
the following financial statements of adidas AG have been prepared
in accordance with the rules set out in the German Commercial Code
(Handelsgesetzbuch – HGB).
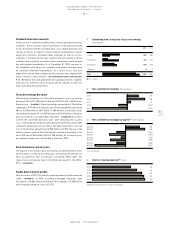
59
/
adidas AG net sales (€ in millions)
2013 2012
Royalty and commission income 1,088 1,111
adidas Germany 701 722
Foreign subsidiaries 103 102
Y-3 44 46
Other revenues 18 23
Total 1,954 2,004