Reebok 2013 Annual Report Download - page 139
Download and view the complete annual report
Please find page 139 of the 2013 Reebok annual report below. You can navigate through the pages in the report by either clicking on the pages listed below, or by using the keyword search tool below to find specific information within the annual report.-
 1
1 -
2
-
3
-
4
-
5
-
6
-
7
-
8
-
9
-
10
-
11
-
12
-
13
-
14
-
15
-
16
-
17
-
18
-
19
-
20
-
21
-
22
-
23
-
24
-
25
-
26
-
27
-
28
-
29
-
30
-
31
-
32
-
33
-
34
-
35
-
36
-
37
-
38
-
39
-
40
-
41
-
42
-
43
-
44
-
45
-
46
-
47
-
48
-
49
-
50
-
51
-
52
-
53
-
54
-
55
-
56
-
57
-
58
-
59
-
60
-
61
-
62
-
63
-
64
-
65
-
66
-
67
-
68
-
69
-
70
-
71
-
72
-
73
-
74
-
75
-
76
-
77
-
78
-
79
-
80
-
81
-
82
-
83
-
84
-
85
-
86
-
87
-
88
-
89
-
90
-
91
-
92
-
93
-
94
-
95
-
96
-
97
-
98
-
99
-
100
-
101
-
102
-
103
-
104
-
105
-
106
-
107
-
108
-
109
-
110
-
111
-
112
-
113
-
114
-
115
-
116
-
117
-
118
-
119
-
120
-
121
-
122
-
123
-
124
-
125
-
126
-
127
-
128
-
 129
129 -
 130
130 -
 131
131 -
 132
132 -
 133
133 -
 134
134 -
 135
135 -
 136
136 -
 137
137 -
 138
138 -
 139
139 -
 140
140 -
 141
141 -
 142
142 -
 143
143 -
 144
144 -
 145
145 -
 146
146 -
 147
147 -
 148
148 -
 149
149 -
150
-
151
-
152
-
153
-
154
-
155
-
156
-
157
-
158
-
159
-
160
-
161
-
162
-
163
-
164
-
165
-
166
-
167
-
168
-
169
-
170
-
171
-
172
-
173
-
174
-
175
-
176
-
177
-
178
-
179
-
180
-
181
-
182
-
183
-
184
-
185
-
186
-
187
-
188
-
189
-
190
-
191
-
192
-
193
-
194
-
195
-
196
-
197
-
198
-
199
-
200
-
201
-
202
-
203
-
204
-
205
-
206
-
207
-
208
-
209
-
210
-
211
-
212
-
213
-
214
-
215
-
216
-
217
-
218
-
219
-
220
-
221
-
222
-
223
-
224
-
225
-
226
-
227
-
228
-
229
-
230
-
231
-
232
-
233
-
234
-
235
-
236
-
237
-
238
-
239
-
240
-
241
-
242
-
243
-
244
-
245
-
246
-
247
-
248
-
249
-
250
-
251
-
252
-
253
-
254
-
255
-
256
-
257
-
258
-
259
-
260
-
261
-
262
-
263
-
264
 |
 |

adidas Group
/
2013 Annual Report
Group Management Report – Financial Review
135
2013
/
03.2
/
Group Business Performance
/
Treasury
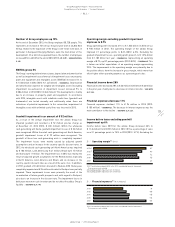
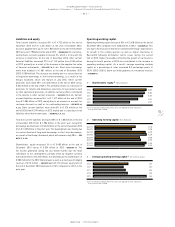
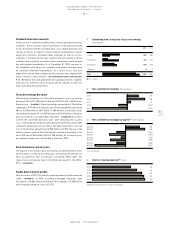
Net cash at December 31, 2013 amounted to € 295 million, compared
to net cash of € 448 million at the end of December 2012, representing
a decrease of € 153 million. Higher working capital requirements as
well as the dividend payment and capital expenditure in 2013 were the
primary drivers of this development
/
SEE TREASURY, P. 135. Currency
translation had a positive effect of € 3 million. The Group’s ratio of net
borrowings over EBITDA amounted to –0.2 at the end of December 2013
(2012: –0.3)
/
DIAGRAM 46.
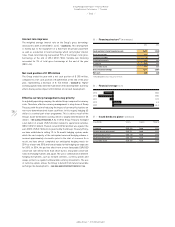
Operating cash flow, as described in the Internal Group Management
System
/
SEE INTERNAL GROUP MANAGEMENT SYSTEM, P. 118, decreased 2% to
€ 827 million in 2013 from € 841 million in the prior year. The decrease
was mainly due to higher working capital requirements and higher
capital expenditure, which more than offset the increase in operating
profit.
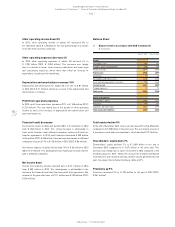
Off-balance sheet items
The Group’s most significant off-balance sheet items are commitments
for promotion and advertising as well as operating leases, which are
related to own-retail stores, offices, warehouses and equipment.
The Group has entered into various operating leases as opposed to
property acquisitions in order to reduce exposure to property value
fluctuations. Minimum future lease payments for operating leases were
€ 1.669 billion at December 31, 2013, compared to € 1.798 billion at
the end of December 2012, representing a decrease of 7%
/
SEE NOTE
27, P. 220. At the end of December 2013, financial commitments for
promotion and advertising increased 1% to € 3.791 billion in 2013 (2012:
€ 3.768 billion)
/
SEE NOTE 37, P. 235.
Treasury
Group financing policy
In order to be able to meet the Group’s payment commitments at all
times, the major goal of our financing policy is to ensure sufficient
liquidity reserves, while at the same time minimising the Group’s
financial expenses. The operating activities of our Group segments and
markets and the resulting cash inflows represent the Group’s main
source of liquidity. Liquidity is planned on a rolling monthly basis under
a multi-year financial and liquidity plan. This comprises all consolidated
Group companies. Our in-house bank concept takes advantage of any
surplus funds of individual Group companies to cover the financial
requirements of others, thus reducing external financing needs
and optimising our net interest expenses. By settling intercompany
transactions via intercompany financial accounts, we are able to reduce
external bank account transactions and thus bank charges. Effective
management of our currency exposure and interest rate risks are
additional goals and responsibilities of our Group Treasury department.
Treasury system and responsibilities
Our Group’s Treasury Policy governs all treasury-related issues,
including banking policy and approval of bank relationships, financing
arrangements and liquidity/asset management, currency and interest
risk management as well as the management of intercompany cash
flows. Responsibilities are arranged in a three-tiered approach:
/
The Treasury Committee consists of members of the Executive Board
and other senior executives who decide on the Group’s Treasury
Policy and provide strategic guidance for managing treasury-related
topics. Major changes to our Treasury Policy are subject to the prior
approval of the Treasury Committee.
/
The Group Treasury department is responsible for specific centralised
treasury transactions and for the global implementation of our
Group’s Treasury Policy.
/
On a subsidiary level, where applicable and economically reasonable,
local managing directors and financial controllers are responsible
for managing treasury matters in their respective subsidiaries.
Controlling functions on a Group level ensure that the transactions
of the individual business units are in compliance with the Group’s
Treasury Policy.
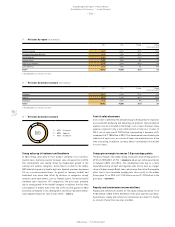
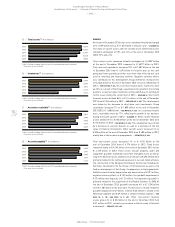
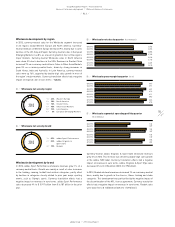
46
/
Net borrowings/EBITDA
2013 (0.2)
2012 (0.3)
2011 (0.1)
2010 0.2
2009 1.2