Reebok 2013 Annual Report Download - page 101
Download and view the complete annual report
Please find page 101 of the 2013 Reebok annual report below. You can navigate through the pages in the report by either clicking on the pages listed below, or by using the keyword search tool below to find specific information within the annual report.-
 1
1 -
2
-
3
-
4
-
5
-
6
-
7
-
8
-
9
-
10
-
11
-
12
-
13
-
14
-
15
-
16
-
17
-
18
-
19
-
20
-
21
-
22
-
23
-
24
-
25
-
26
-
27
-
28
-
29
-
30
-
31
-
32
-
33
-
34
-
35
-
36
-
37
-
38
-
39
-
40
-
41
-
42
-
43
-
44
-
45
-
46
-
47
-
48
-
49
-
50
-
51
-
52
-
53
-
54
-
55
-
56
-
57
-
58
-
59
-
60
-
61
-
62
-
63
-
64
-
65
-
66
-
67
-
68
-
69
-
70
-
71
-
72
-
73
-
74
-
75
-
76
-
77
-
78
-
79
-
80
-
81
-
82
-
83
-
84
-
85
-
86
-
87
-
88
-
89
-
90
-
 91
91 -
 92
92 -
 93
93 -
 94
94 -
 95
95 -
 96
96 -
 97
97 -
 98
98 -
 99
99 -
 100
100 -
 101
101 -
 102
102 -
 103
103 -
 104
104 -
 105
105 -
 106
106 -
 107
107 -
 108
108 -
 109
109 -
 110
110 -
 111
111 -
112
-
113
-
114
-
115
-
116
-
117
-
118
-
119
-
120
-
121
-
122
-
123
-
124
-
125
-
126
-
127
-
128
-
129
-
130
-
131
-
132
-
133
-
134
-
135
-
136
-
137
-
138
-
139
-
140
-
141
-
142
-
143
-
144
-
145
-
146
-
147
-
148
-
149
-
150
-
151
-
152
-
153
-
154
-
155
-
156
-
157
-
158
-
159
-
160
-
161
-
162
-
163
-
164
-
165
-
166
-
167
-
168
-
169
-
170
-
171
-
172
-
173
-
174
-
175
-
176
-
177
-
178
-
179
-
180
-
181
-
182
-
183
-
184
-
185
-
186
-
187
-
188
-
189
-
190
-
191
-
192
-
193
-
194
-
195
-
196
-
197
-
198
-
199
-
200
-
201
-
202
-
203
-
204
-
205
-
206
-
207
-
208
-
209
-
210
-
211
-
212
-
213
-
214
-
215
-
216
-
217
-
218
-
219
-
220
-
221
-
222
-
223
-
224
-
225
-
226
-
227
-
228
-
229
-
230
-
231
-
232
-
233
-
234
-
235
-
236
-
237
-
238
-
239
-
240
-
241
-
242
-
243
-
244
-
245
-
246
-
247
-
248
-
249
-
250
-
251
-
252
-
253
-
254
-
255
-
256
-
257
-
258
-
259
-
260
-
261
-
262
-
263
-
264
 |
 |
adidas Group
/
2013 Annual Report
Group Management Report – Our Group
97
2013
Global Operations
/
02.7
/
03
/
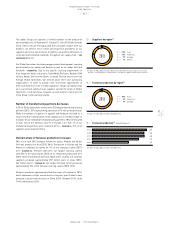
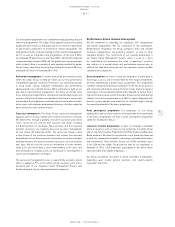
Suppliers by region 1)
1) Figures include adidas, Reebok, adidas Golf and Ashworth, but exclude local sourcing
partners, sourcing agents, subcontractors, second-tier suppliers and licensee factories.
1
/
78% Asia
2
/
14% Americas
3
/
7% Europe
4
/
1% Africa
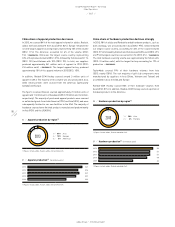
04
/
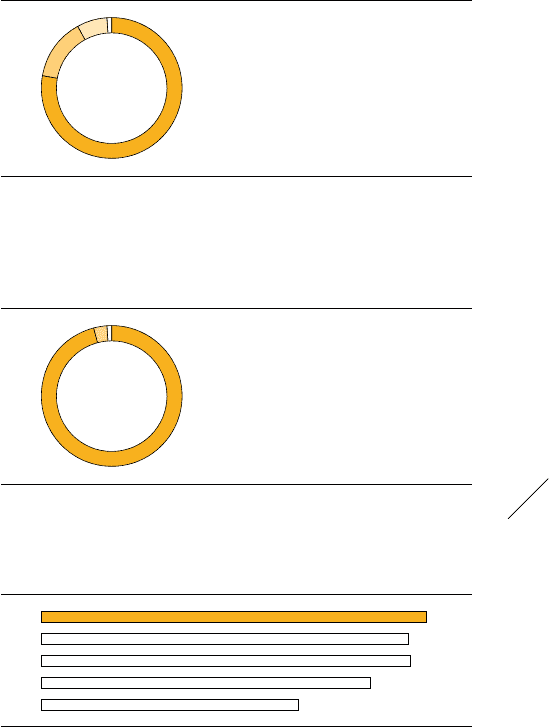
Footwear production by region 1)
1) Figures include adidas, Reebok and adidas Golf.
2013 1
/
96% Asia
2
/
3% Americas
3
/
1% Europe
1
2 3
The adidas Group also operates a limited number of own production
and assembly sites in Germany (1), Finland (1), the USA (5) and Canada
(3). In order to ensure the high quality that consumers expect from our
products, we enforce strict control and inspection procedures at our
suppliers and in our own factories. In addition, we promote adherence to
social and environmental standards throughout our supply chain
/
SEE
SUSTAINABILITY, P. 111.
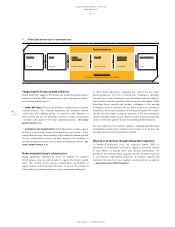
Our Global Operations function manages product development, sourcing
and distribution for adidas and Reebok as well as for adidas Golf and
Ashworth
/
DIAGRAM 02. Due to the specific sourcing requirements in
their respective fields of business, TaylorMade, Rockport, Reebok-CCM
Hockey, Adams Golf and the Sports Licensed Division are not serviced
through Global Operations, but instead utilise their own purchasing
organisations. In order to quickly seize short-term opportunities in
their local market or react to trade regulations, Group subsidiaries may
also source from selected local suppliers outside the realm of Global
Operations. Local purchases, however, account only for a minor portion
of the Group’s total sourcing volume.
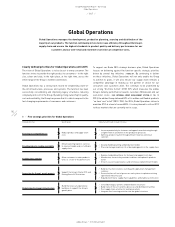
Number of manufacturing partners decreases
In 2013, Global Operations worked with 322 independent manufacturing
partners (2012: 337), representing a decrease of 15 versus the prior year.
While the number of suppliers in apparel and hardware declined as a
result of further rationalisation of the supply base, it remained stable in
footwear. Of our independent manufacturing partners, 78% were located
in Asia, 14% in the Americas and 7% in Europe. Less than 1% of our
manufacturing partners were located in Africa
/
DIAGRAM 03. 31% of all
suppliers were located in China.
Vietnam share of footwear production increases
96% of our total 2013 footwear volume for adidas, Reebok and adidas
Golf was produced in Asia (2012: 96%). Production in Europe and the
Americas combined accounted for 4% of the sourcing volume (2012:
4%)
/
DIAGRAM 04. Vietnam represents our largest sourcing country
with 35% of the total volume (2012: 31%), followed by China with 31%
(2012: 33%) and Indonesia with 24% (2012: 26%). In 2013, our footwear
suppliers produced approximately 257 million pairs of shoes (2012:
244 million pairs)
/
DIAGRAM 05. Our largest footwear factory produced
approximately 10% of the footwear sourcing volume (2012: 10%).
Rockport produced approximately 8 million pairs of footwear in 2013,
which represents a slight increase versus the prior year. Products were
primarily sourced from factories in China (62%), Vietnam (21%), India
(14%) and Indonesia (3%).
05
/
Footwear production 1) (in million pairs)
2013 257
2012 244
2011 245
2010 219
2009 171
1) Figures include adidas, Reebok and adidas Golf.
2013
1
2
3 4