Reebok 2013 Annual Report Download - page 128
Download and view the complete annual report
Please find page 128 of the 2013 Reebok annual report below. You can navigate through the pages in the report by either clicking on the pages listed below, or by using the keyword search tool below to find specific information within the annual report.-
 1
1 -
2
-
3
-
4
-
5
-
6
-
7
-
8
-
9
-
10
-
11
-
12
-
13
-
14
-
15
-
16
-
17
-
18
-
19
-
20
-
21
-
22
-
23
-
24
-
25
-
26
-
27
-
28
-
29
-
30
-
31
-
32
-
33
-
34
-
35
-
36
-
37
-
38
-
39
-
40
-
41
-
42
-
43
-
44
-
45
-
46
-
47
-
48
-
49
-
50
-
51
-
52
-
53
-
54
-
55
-
56
-
57
-
58
-
59
-
60
-
61
-
62
-
63
-
64
-
65
-
66
-
67
-
68
-
69
-
70
-
71
-
72
-
73
-
74
-
75
-
76
-
77
-
78
-
79
-
80
-
81
-
82
-
83
-
84
-
85
-
86
-
87
-
88
-
89
-
90
-
91
-
92
-
93
-
94
-
95
-
96
-
97
-
98
-
99
-
100
-
101
-
102
-
103
-
104
-
105
-
106
-
107
-
108
-
109
-
110
-
111
-
112
-
113
-
114
-
115
-
116
-
117
-
 118
118 -
 119
119 -
 120
120 -
 121
121 -
 122
122 -
 123
123 -
 124
124 -
 125
125 -
 126
126 -
 127
127 -
 128
128 -
 129
129 -
 130
130 -
 131
131 -
 132
132 -
 133
133 -
 134
134 -
 135
135 -
 136
136 -
 137
137 -
 138
138 -
139
-
140
-
141
-
142
-
143
-
144
-
145
-
146
-
147
-
148
-
149
-
150
-
151
-
152
-
153
-
154
-
155
-
156
-
157
-
158
-
159
-
160
-
161
-
162
-
163
-
164
-
165
-
166
-
167
-
168
-
169
-
170
-
171
-
172
-
173
-
174
-
175
-
176
-
177
-
178
-
179
-
180
-
181
-
182
-
183
-
184
-
185
-
186
-
187
-
188
-
189
-
190
-
191
-
192
-
193
-
194
-
195
-
196
-
197
-
198
-
199
-
200
-
201
-
202
-
203
-
204
-
205
-
206
-
207
-
208
-
209
-
210
-
211
-
212
-
213
-
214
-
215
-
216
-
217
-
218
-
219
-
220
-
221
-
222
-
223
-
224
-
225
-
226
-
227
-
228
-
229
-
230
-
231
-
232
-
233
-
234
-
235
-
236
-
237
-
238
-
239
-
240
-
241
-
242
-
243
-
244
-
245
-
246
-
247
-
248
-
249
-
250
-
251
-
252
-
253
-
254
-
255
-
256
-
257
-
258
-
259
-
260
-
261
-
262
-
263
-
264
 |
 |
adidas Group
/
2013 Annual Report
Group Management Report – Financial Review
124
2013
/
03.2
/
Group Business Performance
/
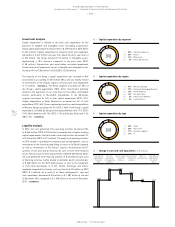
Economic and Sector Development
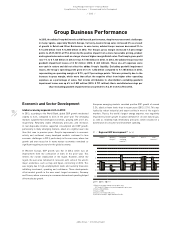
Modest growth of Europe’s sporting goods industry
In Europe, despite high unemployment and low consumer confidence in
many markets, the sporting goods industry grew modestly. The sector
faced challenging comparisons to the prior year, which had been buoyed
by the major sporting events of the London 2012 Olympic and Paralympic
Games as well as the UEFA EURO 2012. Nonetheless, the industry gained
momentum towards year-end due to the build-up to the 2014 FIFA World
Cup in Brazil, which helped drive sales of federation jerseys and football-
related products. In European emerging markets, slower disposable
income growth rates negatively impacted consumer sentiment and
spending, resulting in lower retail traffic in 2013, especially in Russia.
Robust retail activity drives North American sporting
goods industry
In the USA, the sporting goods industry posted a robust performance,
with relatively low inflation and slight improvements in consumer
confidence helping drive consumer spending. We estimate that sales in
the sporting goods sector increased at a mid- to high-single-digit rate,
driven by improvements in product mix as retailers focused on premium
and highly innovative products. Strong retail trends in basketball,
high-performance running and sporting lifestyle apparel more than
offset slight contractions in the lifestyle running, outdoor and golf
categories. Digital presence and e-commerce continued to see rapid
expansion across the industry in 2013. Cold weather in the USA towards
year-end encouraged consumers to go online and, in conjunction with
discounting, added momentum to this increasingly important channel.
US sports footwear sales are estimated to have increased at a mid- to
high-single-digit rate in 2013, driven in particular by increases in the
basketball and high-performance running categories. Highly innovative
performance products also fuelled growth in US sporting apparel sales,
which are estimated to have increased at a high-single-digit rate.
Asian sporting goods industry continues to expand
Strong wage increases and rising consumer spending, albeit lower than
in recent years, fuelled increases in Asia’s sporting goods industry,
which we estimate grew at a low- to mid-single-digit rate in 2013. The
region’s industry expansion continues to be driven by international
brands. In China, this trend was particularly evident, with many
domestic brands remaining focused on inventory clearance and store
network consolidation. In Japan, economic progress helped support
improvements in consumer spending and a recovery in retail and
sporting goods sales, particularly in the second half of the year.
Latin America’s sporting goods industry records
strong momentum
In Latin America, low unemployment levels and higher wages supported
healthy retail and sporting goods sales. However, high inflationary
pressures lessened the robust expansion of the sector during the year.
Due to the importance of football for the region, the sporting goods
sector also benefited, principally in the second half of 2013, from sales
relating to the build-up to the 2014 FIFA World Cup, which is being
hosted by Brazil.
adidas Group and competitors outperform economic
environment
adidas Group currency-neutral revenues and profitability, as well as that
of many competitors and retailers, increased in 2013. In most regions,
sales of our Group and other major sporting goods companies grew at a
higher rate than GDP and overall consumer spending.
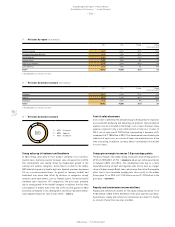
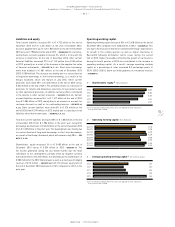
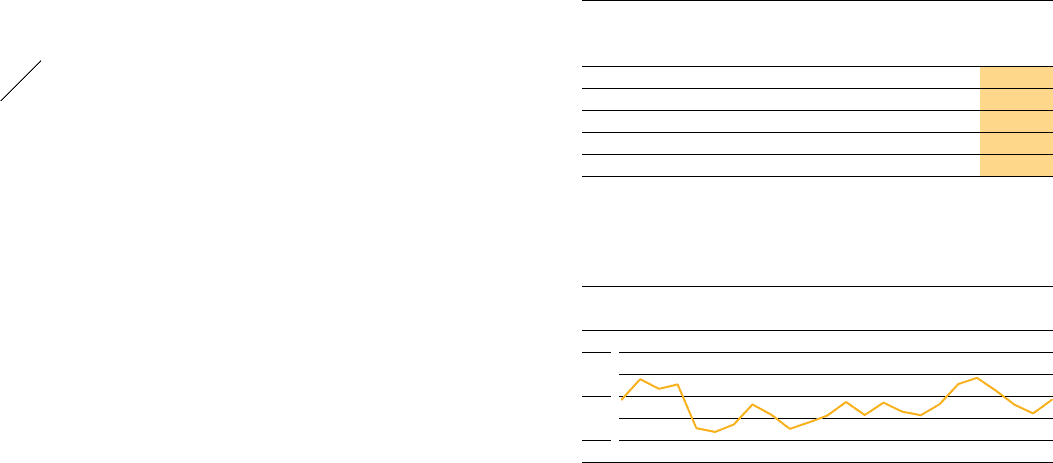
06
/
Oil price development 1) (in US $ per barrel)
| Jan. 1, 2012 Dec. 31, 2013 |
120
100
80
1) West Texas Intermediate Cushing crude oil. Source: Bloomberg.
05
/
Exchange rate development 1) (€ 1 equals)
Average
rate
2012
Q1 2013 Q2 2013 Q3 2013 Q4 2013 Average
rate
2013
USD 1.2862 1.2805 1.3080 1.3505 1.3791 1.3283
GBP 0.8115 0.8456 0.8572 0.8361 0.8337 0.8492
JPY 102.65 120.87 129.39 131.78 144.72 129.58
RUB 39.951 39.802 42.783 43.682 45.137 42.298
CNY 8.1137 8.0341 8.0817 8.3029 8.4082 8.1674
1) Spot rates at quarter-end.