Reebok 2013 Annual Report Download - page 232
Download and view the complete annual report
Please find page 232 of the 2013 Reebok annual report below. You can navigate through the pages in the report by either clicking on the pages listed below, or by using the keyword search tool below to find specific information within the annual report.-
 1
1 -
2
-
3
-
4
-
5
-
6
-
7
-
8
-
9
-
10
-
11
-
12
-
13
-
14
-
15
-
16
-
17
-
18
-
19
-
20
-
21
-
22
-
23
-
24
-
25
-
26
-
27
-
28
-
29
-
30
-
31
-
32
-
33
-
34
-
35
-
36
-
37
-
38
-
39
-
40
-
41
-
42
-
43
-
44
-
45
-
46
-
47
-
48
-
49
-
50
-
51
-
52
-
53
-
54
-
55
-
56
-
57
-
58
-
59
-
60
-
61
-
62
-
63
-
64
-
65
-
66
-
67
-
68
-
69
-
70
-
71
-
72
-
73
-
74
-
75
-
76
-
77
-
78
-
79
-
80
-
81
-
82
-
83
-
84
-
85
-
86
-
87
-
88
-
89
-
90
-
91
-
92
-
93
-
94
-
95
-
96
-
97
-
98
-
99
-
100
-
101
-
102
-
103
-
104
-
105
-
106
-
107
-
108
-
109
-
110
-
111
-
112
-
113
-
114
-
115
-
116
-
117
-
118
-
119
-
120
-
121
-
122
-
123
-
124
-
125
-
126
-
127
-
128
-
129
-
130
-
131
-
132
-
133
-
134
-
135
-
136
-
137
-
138
-
139
-
140
-
141
-
142
-
143
-
144
-
145
-
146
-
147
-
148
-
149
-
150
-
151
-
152
-
153
-
154
-
155
-
156
-
157
-
158
-
159
-
160
-
161
-
162
-
163
-
164
-
165
-
166
-
167
-
168
-
169
-
170
-
171
-
172
-
173
-
174
-
175
-
176
-
177
-
178
-
179
-
180
-
181
-
182
-
183
-
184
-
185
-
186
-
187
-
188
-
189
-
190
-
191
-
192
-
193
-
194
-
195
-
196
-
197
-
198
-
199
-
200
-
201
-
202
-
203
-
204
-
205
-
206
-
207
-
208
-
209
-
210
-
211
-
212
-
213
-
214
-
215
-
216
-
217
-
218
-
219
-
220
-
221
-
 222
222 -
 223
223 -
 224
224 -
 225
225 -
 226
226 -
 227
227 -
 228
228 -
 229
229 -
 230
230 -
 231
231 -
 232
232 -
 233
233 -
 234
234 -
 235
235 -
 236
236 -
 237
237 -
 238
238 -
 239
239 -
 240
240 -
 241
241 -
 242
242 -
243
-
244
-
245
-
246
-
247
-
248
-
249
-
250
-
251
-
252
-
253
-
254
-
255
-
256
-
257
-
258
-
259
-
260
-
261
-
262
-
263
-
264
 |
 |
adidas Group
/
2013 Annual Report
Consolidated Financial Statements
228
2013
/
04.8
/
Notes
/
Notes to the Consolidated Income Statement
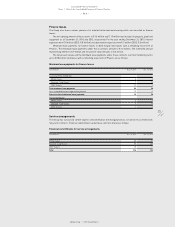
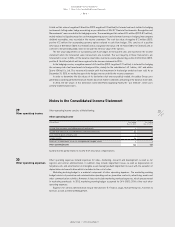
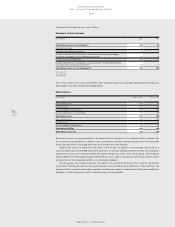
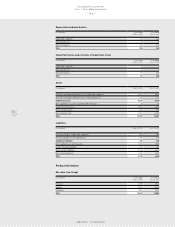
Depreciation and amortisation expense for tangible and intangible assets (except goodwill impairment losses)
and impairment losses were € 291 million and € 266 million for the years ending December 31, 2013 and 2012,
respectively. Thereof, € 3 million and € 3 million were recorded within the cost of sales as they are directly
assigned to the production costs.
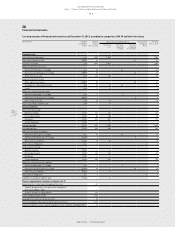
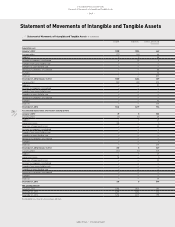
Other operating expenses
(€ in millions) Year ending
Dec. 31, 2013
Year ending
Dec. 31, 2012
Marketing working budget 1,457 1,502
Sales working budget 340 304
Marketing overhead 1) 425 445
Sales force 1) 1,890 1,885
Logistics 1) 766 750
Research and development 1) 128 128
Central administration 1) 1,127 1,136
Other operating expenses 6,133 6,150
Thereof:
Depreciation, amortisation and impairment losses 288 263
1) Including personnel and administration expenses.
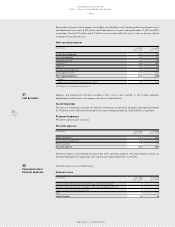
Expenses are presented by function according to the “cost of sales method” in the income statement.
Supplementary information on the expenses by nature is detailed below.
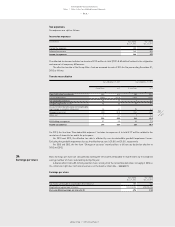
Cost of materials
The total cost of materials relating to the amount of inventories recognised as an expense during the period was
€ 7.210 billion and € 7.641 billion (restated) for the years ending December 31, 2013 and 2012, respectively.
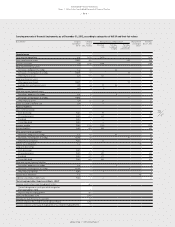
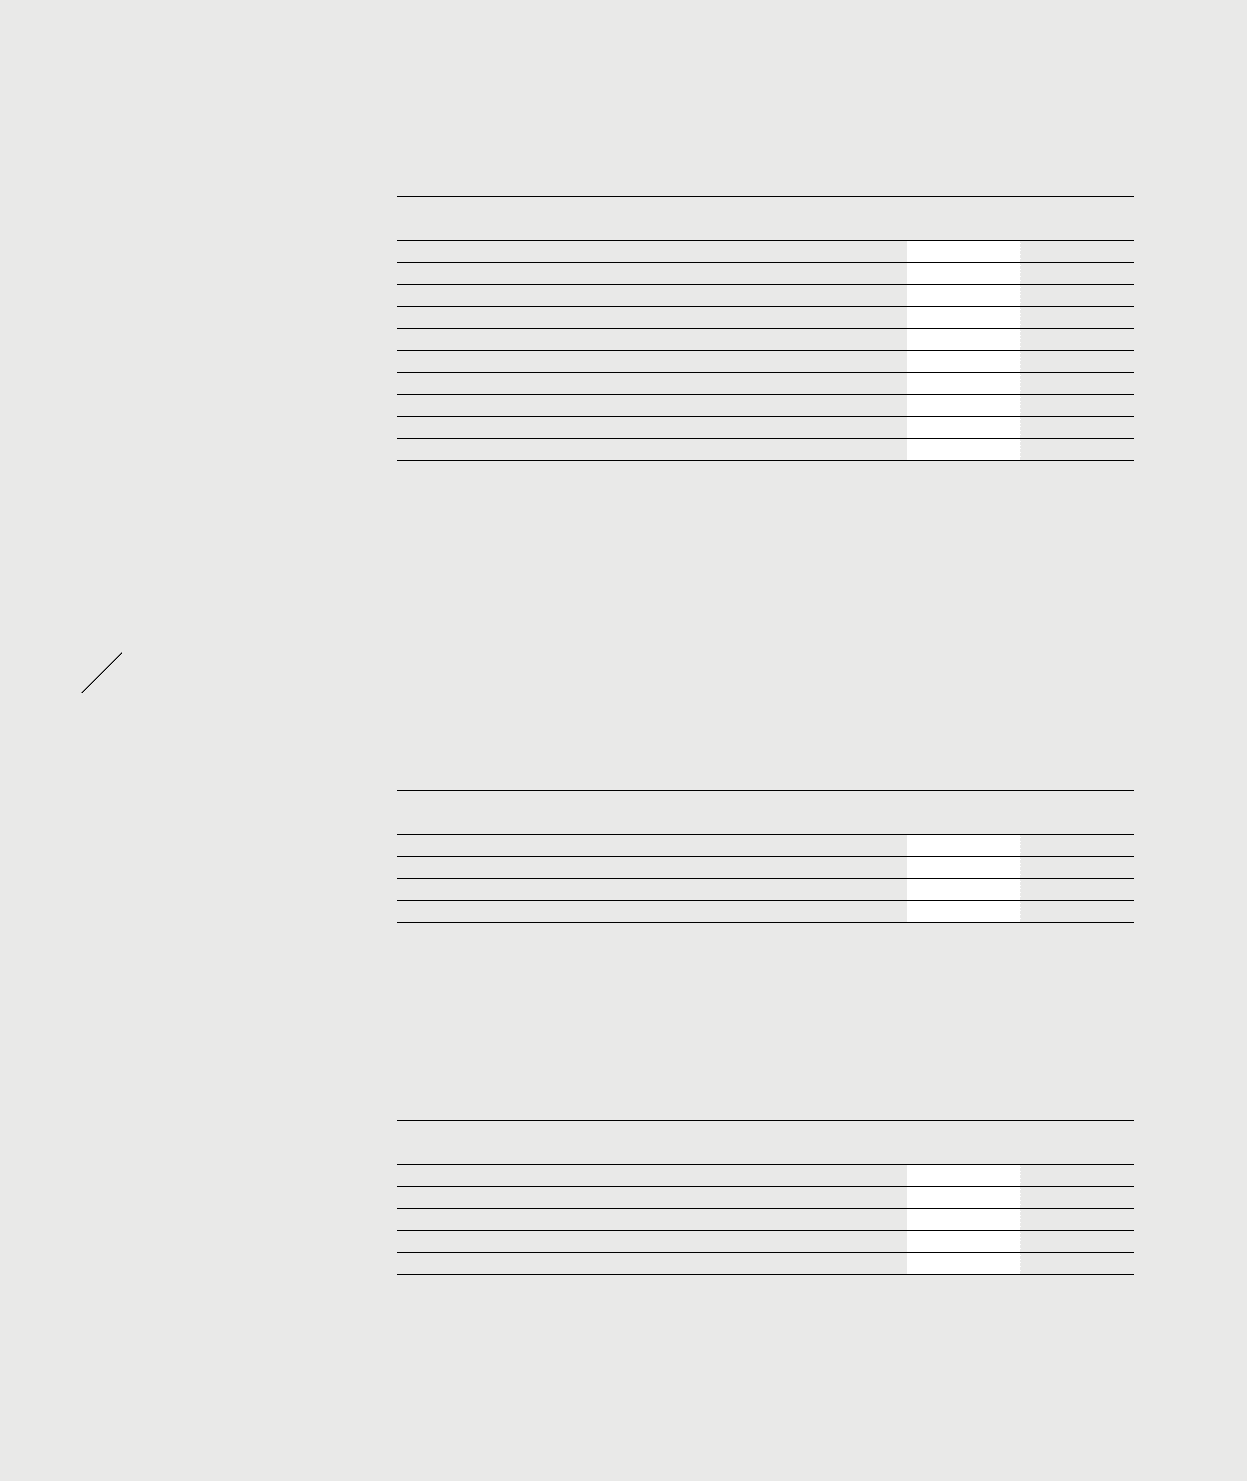
Personnel expenses
Personnel expenses were as follows:
Personnel expenses
(€ in millions) Year ending
Dec. 31, 2013
Year ending
Dec. 31, 2012
Wages and salaries 1,628 1,634
Social security contributions 177 169
Pension expenses 71 69
Personnel expenses 1,876 1,872
Personnel expenses are primarily included within other operating expenses. Personnel expenses which are
directly attributable to the production costs of goods are included within the cost of sales.
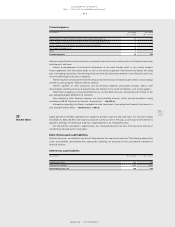
Financial result consists of the following:
Financial income
(€ in millions) Year ending
Dec. 31, 2013
Year ending
Dec. 31, 2012
Interest income from financial instruments measured at amortised cost 8 13
Interest income from financial instruments at fair value through profit or loss 17 22
Interest income from non-financial assets 0 0
Other 1 1
Financial income 26 36
31
Cost by nature
32
Financial income/
financial expenses