Reebok 2013 Annual Report Download - page 237
Download and view the complete annual report
Please find page 237 of the 2013 Reebok annual report below. You can navigate through the pages in the report by either clicking on the pages listed below, or by using the keyword search tool below to find specific information within the annual report.-
 1
1 -
2
-
3
-
4
-
5
-
6
-
7
-
8
-
9
-
10
-
11
-
12
-
13
-
14
-
15
-
16
-
17
-
18
-
19
-
20
-
21
-
22
-
23
-
24
-
25
-
26
-
27
-
28
-
29
-
30
-
31
-
32
-
33
-
34
-
35
-
36
-
37
-
38
-
39
-
40
-
41
-
42
-
43
-
44
-
45
-
46
-
47
-
48
-
49
-
50
-
51
-
52
-
53
-
54
-
55
-
56
-
57
-
58
-
59
-
60
-
61
-
62
-
63
-
64
-
65
-
66
-
67
-
68
-
69
-
70
-
71
-
72
-
73
-
74
-
75
-
76
-
77
-
78
-
79
-
80
-
81
-
82
-
83
-
84
-
85
-
86
-
87
-
88
-
89
-
90
-
91
-
92
-
93
-
94
-
95
-
96
-
97
-
98
-
99
-
100
-
101
-
102
-
103
-
104
-
105
-
106
-
107
-
108
-
109
-
110
-
111
-
112
-
113
-
114
-
115
-
116
-
117
-
118
-
119
-
120
-
121
-
122
-
123
-
124
-
125
-
126
-
127
-
128
-
129
-
130
-
131
-
132
-
133
-
134
-
135
-
136
-
137
-
138
-
139
-
140
-
141
-
142
-
143
-
144
-
145
-
146
-
147
-
148
-
149
-
150
-
151
-
152
-
153
-
154
-
155
-
156
-
157
-
158
-
159
-
160
-
161
-
162
-
163
-
164
-
165
-
166
-
167
-
168
-
169
-
170
-
171
-
172
-
173
-
174
-
175
-
176
-
177
-
178
-
179
-
180
-
181
-
182
-
183
-
184
-
185
-
186
-
187
-
188
-
189
-
190
-
191
-
192
-
193
-
194
-
195
-
196
-
197
-
198
-
199
-
200
-
201
-
202
-
203
-
204
-
205
-
206
-
207
-
208
-
209
-
210
-
211
-
212
-
213
-
214
-
215
-
216
-
217
-
218
-
219
-
220
-
221
-
222
-
223
-
224
-
225
-
226
-
 227
227 -
 228
228 -
 229
229 -
 230
230 -
 231
231 -
 232
232 -
 233
233 -
 234
234 -
 235
235 -
 236
236 -
 237
237 -
 238
238 -
 239
239 -
 240
240 -
 241
241 -
 242
242 -
 243
243 -
 244
244 -
 245
245 -
 246
246 -
 247
247 -
248
-
249
-
250
-
251
-
252
-
253
-
254
-
255
-
256
-
257
-
258
-
259
-
260
-
261
-
262
-
263
-
264
 |
 |
adidas Group
/
2013 Annual Report
Consolidated Financial Statements
233
2013
/
04.8
/
Notes
/
Notes – Additional Information
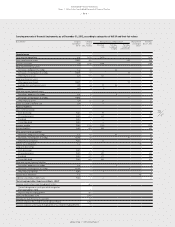
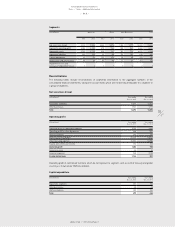
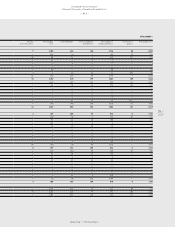
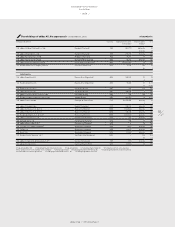
Segments
(€ in millions) Wholesale Retail Other Businesses Total
2013 2012 2013 2012 2013 2012 2013 2012
Net sales (non-Group) 9,100 9,533 3,446 3,373 1,946 1,977 14,492 14,883
Segmental operating profit 3,082 2,965 678 724 508 541 4,268 4,230
Segmental assets 2,763 2,715 898 721 749 712 4,410 4,148
Segmental liabilities 360 392 99 58 176 190 635 640
Capital expenditure 62 53 139 103 28 28 229 184
Depreciation and amortisation 45 39 87 83 11 11 143 133
Impairment losses and
reversals of impairment losses 1 2 1 1 0 0 2 3
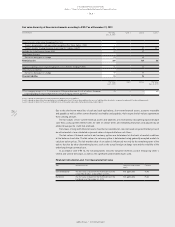
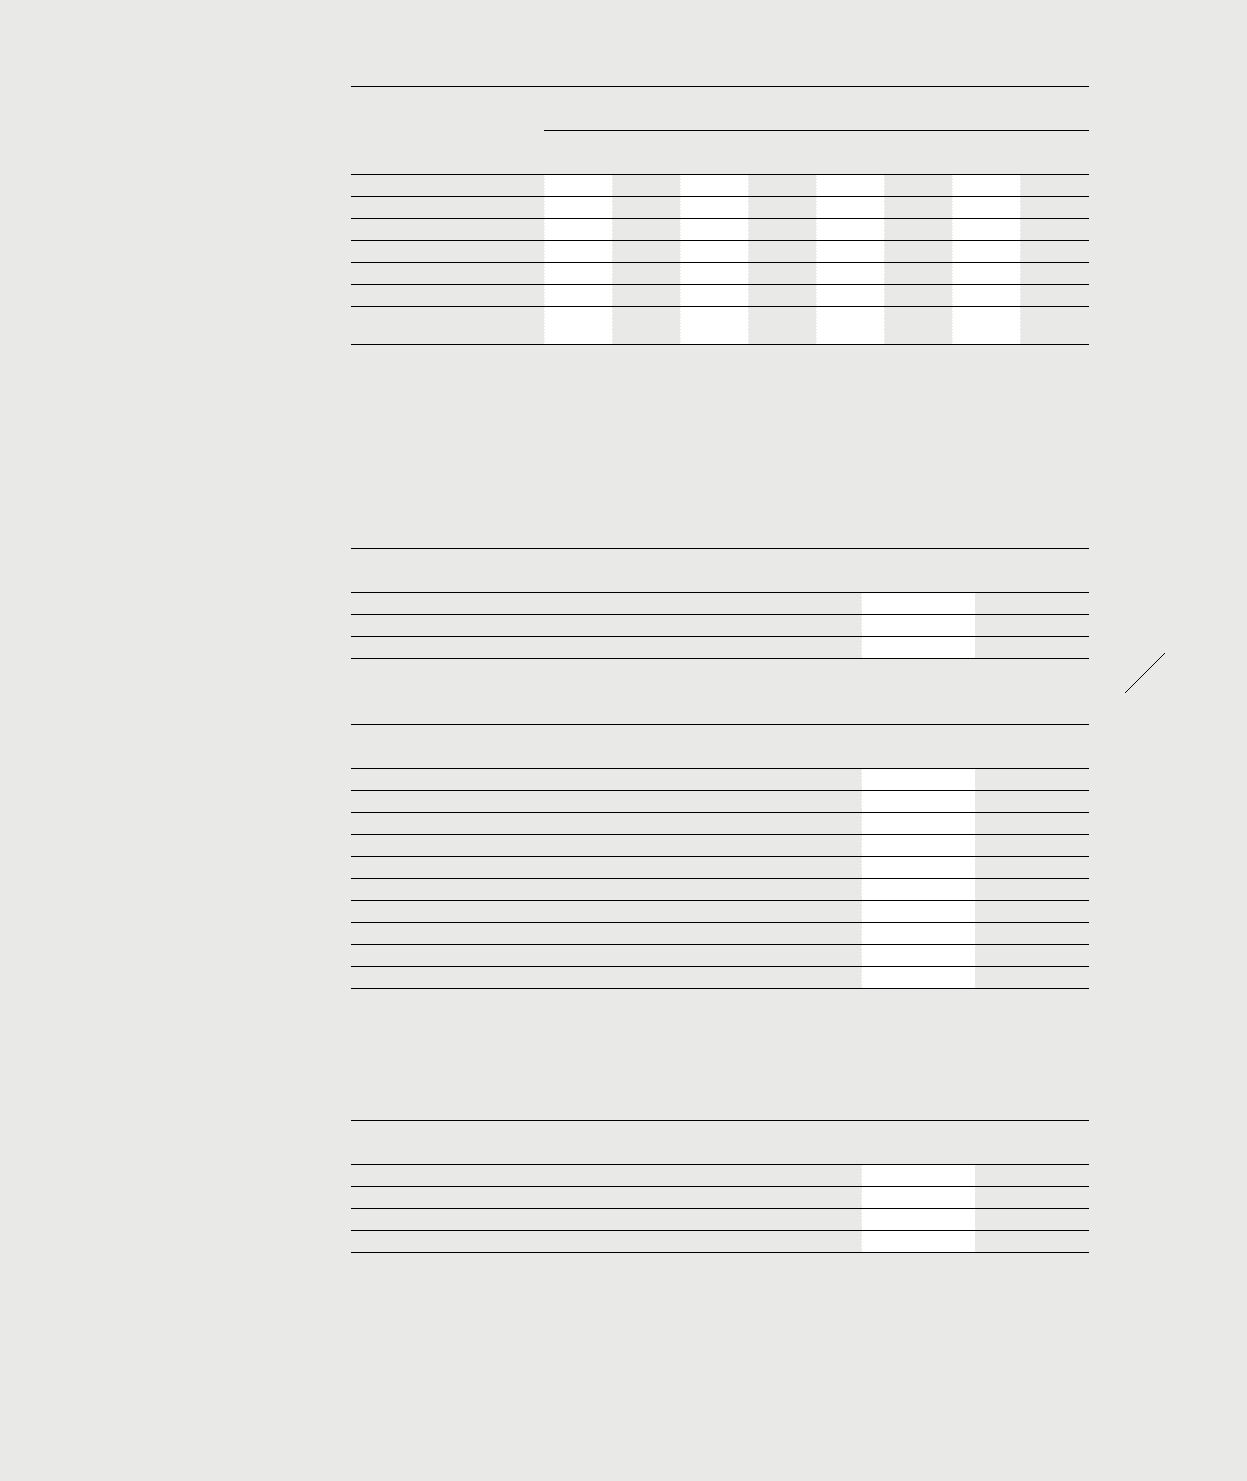
Reconciliations
The following tables include reconciliations of segmental information to the aggregate numbers of the
consolidated financial statements, taking into account items which are not directly attributable to a segment or
a group of segments.
Net sales (non-Group)
(€ in millions) Year ending
Dec. 31, 2013
Year ending
Dec. 31, 2012
Reportable segments 12,546 12,906
Other businesses 1,946 1,977
Total 14,492 14,883
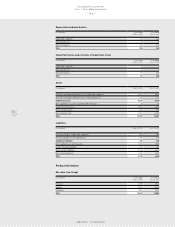
Operating profit
(€ in millions) Year ending
Dec. 31, 2013
Year ending
Dec. 31, 2012
Operating profit for reportable segments 3,760 3,689
Operating profit for other businesses 508 541
HQ/Consolidation 293 345
Marketing working budget (1,457) (1,502)
Other operating expenses (2,006) (2,258)
Royalty and commission income 104 105
Operating profit 1,202 920
Financial income 26 36
Financial expenses (94) (105)
Income before taxes 1,134 851
Operating profit of centralised functions which do not represent a segment, such as central treasury and global
sourcing, is shown under HQ/Consolidation.
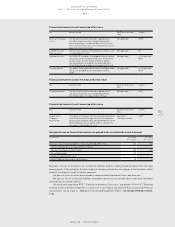
Capital expenditure
(€ in millions) Year ending
Dec. 31, 2013
Year ending
Dec. 31, 2012
Reportable segments 201 156
Other businesses 28 28
HQ/Consolidation 250 250
Total 479 434