Reebok 2013 Annual Report Download - page 160
Download and view the complete annual report
Please find page 160 of the 2013 Reebok annual report below. You can navigate through the pages in the report by either clicking on the pages listed below, or by using the keyword search tool below to find specific information within the annual report.-
 1
1 -
2
-
3
-
4
-
5
-
6
-
7
-
8
-
9
-
10
-
11
-
12
-
13
-
14
-
15
-
16
-
17
-
18
-
19
-
20
-
21
-
22
-
23
-
24
-
25
-
26
-
27
-
28
-
29
-
30
-
31
-
32
-
33
-
34
-
35
-
36
-
37
-
38
-
39
-
40
-
41
-
42
-
43
-
44
-
45
-
46
-
47
-
48
-
49
-
50
-
51
-
52
-
53
-
54
-
55
-
56
-
57
-
58
-
59
-
60
-
61
-
62
-
63
-
64
-
65
-
66
-
67
-
68
-
69
-
70
-
71
-
72
-
73
-
74
-
75
-
76
-
77
-
78
-
79
-
80
-
81
-
82
-
83
-
84
-
85
-
86
-
87
-
88
-
89
-
90
-
91
-
92
-
93
-
94
-
95
-
96
-
97
-
98
-
99
-
100
-
101
-
102
-
103
-
104
-
105
-
106
-
107
-
108
-
109
-
110
-
111
-
112
-
113
-
114
-
115
-
116
-
117
-
118
-
119
-
120
-
121
-
122
-
123
-
124
-
125
-
126
-
127
-
128
-
129
-
130
-
131
-
132
-
133
-
134
-
135
-
136
-
137
-
138
-
139
-
140
-
141
-
142
-
143
-
144
-
145
-
146
-
147
-
148
-
149
-
 150
150 -
 151
151 -
 152
152 -
 153
153 -
 154
154 -
 155
155 -
 156
156 -
 157
157 -
 158
158 -
 159
159 -
 160
160 -
 161
161 -
 162
162 -
 163
163 -
 164
164 -
 165
165 -
 166
166 -
 167
167 -
 168
168 -
 169
169 -
 170
170 -
171
-
172
-
173
-
174
-
175
-
176
-
177
-
178
-
179
-
180
-
181
-
182
-
183
-
184
-
185
-
186
-
187
-
188
-
189
-
190
-
191
-
192
-
193
-
194
-
195
-
196
-
197
-
198
-
199
-
200
-
201
-
202
-
203
-
204
-
205
-
206
-
207
-
208
-
209
-
210
-
211
-
212
-
213
-
214
-
215
-
216
-
217
-
218
-
219
-
220
-
221
-
222
-
223
-
224
-
225
-
226
-
227
-
228
-
229
-
230
-
231
-
232
-
233
-
234
-
235
-
236
-
237
-
238
-
239
-
240
-
241
-
242
-
243
-
244
-
245
-
246
-
247
-
248
-
249
-
250
-
251
-
252
-
253
-
254
-
255
-
256
-
257
-
258
-
259
-
260
-
261
-
262
-
263
-
264
 |
 |

adidas Group
/
2013 Annual Report
Group Management Report – Financial Review
156
2013
Subsequent Events and Outlook
/
03.4
/
Capital expenditure to be between € 500 million
and € 550 million
In 2014, capital expenditure is expected to amount to between
€ 500 million and € 550 million (2013: € 479 million). Investments will
focus on adidas and Reebok controlled space initiatives, in particular
in emerging markets. These investments will account for around 50%
of total investments in 2014. Other areas of investment include the
Group’s logistics infrastructure, the further development of the adidas
Group headquarters in Herzogenaurach, Germany, and the increased
deployment of SAP and other IT systems in major subsidiaries within
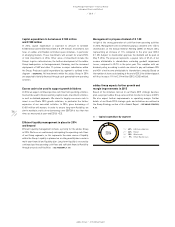
the Group. Projected capital expenditure by segment is outlined in the
diagram
/
DIAGRAM 02. All investments within the adidas Group in 2014
are expected to be fully financed through cash generated from operating
activities.
Excess cash to be used to support growth initiatives
In 2014, we expect continued positive cash flow from operating activities.
Cash will be used to finance working capital needs, investment activities,
as well as dividend payments. We intend to largely use excess cash to
invest in our Route 2015 growth initiatives, in particular the further
expansion of our own-retail activities. In 2014, gross borrowings of
€ 681 million will mature. In order to ensure long-term flexibility, we
aim to maintain a ratio of net borrowings over EBITDA of less than two
times as measured at year-end (2013: –0.2).
Efficient liquidity management in place for 2014
and beyond
Efficient liquidity management remains a priority for the adidas Group
in 2014. We focus on continuously anticipating the operating cash flows
of our Group segments, as this represents the main source of liquidity
within the Group. Liquidity is planned on a rolling monthly basis under a
multi-year financial and liquidity plan. Long-term liquidity is ensured by
continued positive operating cash flows and sufficient financial flexibility
through unused credit facilities
/
SEE TREASURY, P. 135.
Management to propose dividend of € 1.50
In light of the strong generation of cash flow from operating activities
in 2013, Management will recommend paying a dividend of € 1.50 to
shareholders at the Annual General Meeting (AGM) on May 8, 2014,
representing an increase of 11% compared to the prior year (2012:
€ 1.35). Subject to shareholder approval, the dividend will be paid on
May 9, 2014. The proposal represents a payout ratio of 37.4% of net
income attributable to shareholders excluding goodwill impairment
losses, compared to 35.7% in the prior year. This complies with our
dividend policy, according to which we intend to pay out between 20%
and 40% of net income attributable to shareholders annually. Based on
the number of shares outstanding at the end of 2013, the dividend payout
will thus increase 11% to € 314 million (2012: € 282 million).
adidas Group expects further growth and
margin improvements in 2015
Based on the initiatives laid out in our Route 2015 strategic business
plan, we project adidas Group sales and net income to increase in 2015.
We also expect further improvements in operating margin. Further
details of our Route 2015 strategic goals and initiatives are outlined in
the Group Strategy section of this Annual Report
/
SEE GROUP STRATEGY,
P. 68.
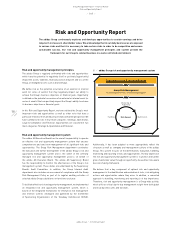
02
/
Capital expenditure by segment
2014
1
/
40% HQ/Consolidation
2
/
36% Retail
3
/
15% Wholesale
4
/
9% Other Businesses
1
2
3
4