Reebok 2013 Annual Report Download - page 141
Download and view the complete annual report
Please find page 141 of the 2013 Reebok annual report below. You can navigate through the pages in the report by either clicking on the pages listed below, or by using the keyword search tool below to find specific information within the annual report.-
 1
1 -
2
-
3
-
4
-
5
-
6
-
7
-
8
-
9
-
10
-
11
-
12
-
13
-
14
-
15
-
16
-
17
-
18
-
19
-
20
-
21
-
22
-
23
-
24
-
25
-
26
-
27
-
28
-
29
-
30
-
31
-
32
-
33
-
34
-
35
-
36
-
37
-
38
-
39
-
40
-
41
-
42
-
43
-
44
-
45
-
46
-
47
-
48
-
49
-
50
-
51
-
52
-
53
-
54
-
55
-
56
-
57
-
58
-
59
-
60
-
61
-
62
-
63
-
64
-
65
-
66
-
67
-
68
-
69
-
70
-
71
-
72
-
73
-
74
-
75
-
76
-
77
-
78
-
79
-
80
-
81
-
82
-
83
-
84
-
85
-
86
-
87
-
88
-
89
-
90
-
91
-
92
-
93
-
94
-
95
-
96
-
97
-
98
-
99
-
100
-
101
-
102
-
103
-
104
-
105
-
106
-
107
-
108
-
109
-
110
-
111
-
112
-
113
-
114
-
115
-
116
-
117
-
118
-
119
-
120
-
121
-
122
-
123
-
124
-
125
-
126
-
127
-
128
-
129
-
130
-
 131
131 -
 132
132 -
 133
133 -
 134
134 -
 135
135 -
 136
136 -
 137
137 -
 138
138 -
 139
139 -
 140
140 -
 141
141 -
 142
142 -
 143
143 -
 144
144 -
 145
145 -
 146
146 -
 147
147 -
 148
148 -
 149
149 -
 150
150 -
 151
151 -
152
-
153
-
154
-
155
-
156
-
157
-
158
-
159
-
160
-
161
-
162
-
163
-
164
-
165
-
166
-
167
-
168
-
169
-
170
-
171
-
172
-
173
-
174
-
175
-
176
-
177
-
178
-
179
-
180
-
181
-
182
-
183
-
184
-
185
-
186
-
187
-
188
-
189
-
190
-
191
-
192
-
193
-
194
-
195
-
196
-
197
-
198
-
199
-
200
-
201
-
202
-
203
-
204
-
205
-
206
-
207
-
208
-
209
-
210
-
211
-
212
-
213
-
214
-
215
-
216
-
217
-
218
-
219
-
220
-
221
-
222
-
223
-
224
-
225
-
226
-
227
-
228
-
229
-
230
-
231
-
232
-
233
-
234
-
235
-
236
-
237
-
238
-
239
-
240
-
241
-
242
-
243
-
244
-
245
-
246
-
247
-
248
-
249
-
250
-
251
-
252
-
253
-
254
-
255
-
256
-
257
-
258
-
259
-
260
-
261
-
262
-
263
-
264
 |
 |
adidas Group
/
2013 Annual Report
Group Management Report – Financial Review
137
2013
/
03.2
/
Group Business Performance
/
Treasury
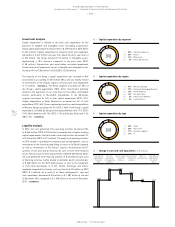
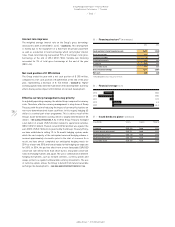
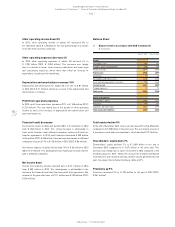
52
/
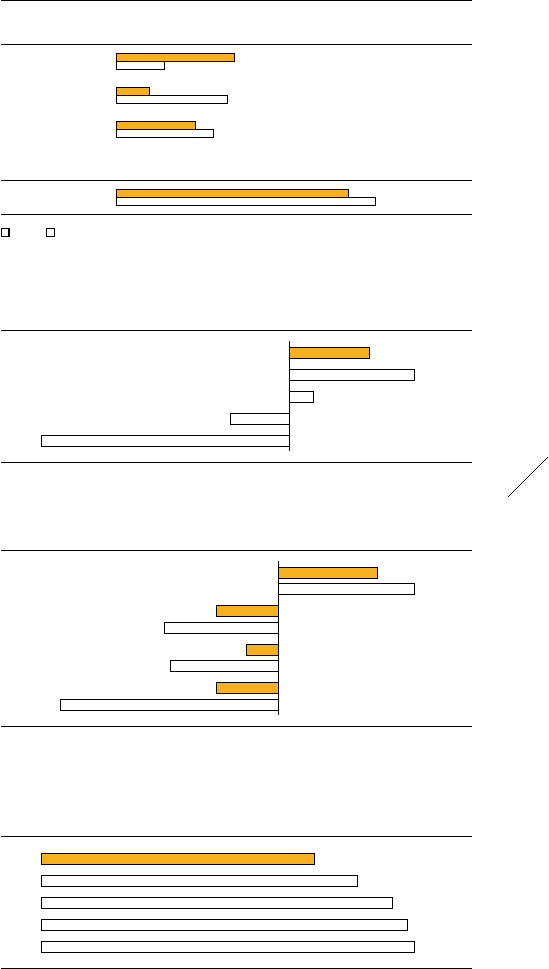
Net cash/(net borrowings) (€ in millions)
2013 295
2012 448
2011 90
2010 (221)
2009 (917)
54
/
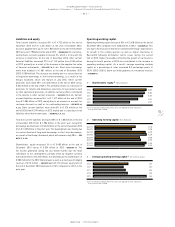
Interest rate development 1) (in %)
2013 3.8
2012 4.4
2011 4.9
2010 5.1
2009 5.2
1) Weighted average interest rate of gross borrowings.
53
/
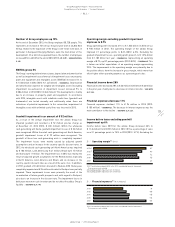
Net cash/(net borrowings) by quarter 1) (€ in millions)
Q4 2013 295
Q4 2012 448
Q3 2013 (180)
Q3 2012 (337)
Q2 2013 (94)
Q2 2012 (318)
Q1 2013 (180)
Q1 2012 (640)
1) At end of period.
51
/
Remaining time to maturity of gross borrowings
(€ in millions)
2013 2012
< 1 year 681 280
1 to 3 years 193 644
3 to 5 years 460 563
> 5 years 00
Total 1,334 1,487
■ 2013 ■ 2012
Standard financial covenants
In the case of our committed credit facilities, we have entered into various
covenants. These covenants may include limits on the disposal of fixed
assets, the amount of debt secured by liens, cross default provisions and
change of control. In addition, certain financial arrangements contain
equity ratio covenants, minimum equity covenants as well as net loss
covenants. If we failed to meet any covenant and were unable to obtain
a waiver from a majority of partner banks, borrowings would become
due and payable immediately. As at December 31, 2013, we were in
full compliance with all of our covenants, with ample coverage above
all stipulated minimum requirements. As a result of our cash flow
expectations, we are fully confident we will continue to be compliant with
these covenants going forward
/
SEE SUBSEQUENT EVENTS AND OUTLOOK,
P. 151. We believe that cash generated from operating activities, together
with access to external sources of funds, will be sufficient to meet our
future operating and capital needs.
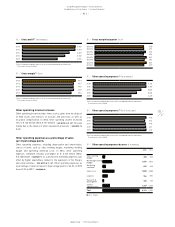
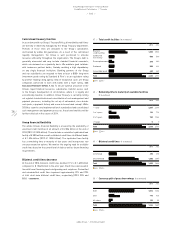
Gross borrowings decrease
Following the repayment of a US private placement, gross borrowings
decreased 10% to € 1.334 billion at the end of 2013 from € 1.487 billion in
the prior year
/
DIAGRAM 51. Bank borrowings amounted to € 126 million
compared to € 59 million in the prior year. Private placements decreased
48% to € 248 million in 2013 (2012: € 480 million). Convertible bonds
outstanding increased 3% to € 460 million from € 449 million in the prior
year, as a result of accruing the debt component
/
DIAGRAM 55. At issuance
in 2012, the convertible bond was split – after deducting the issuance
costs – into the equity component amounting to € 55 million and the debt
component amounting to € 441 million. The debt component is accrued
to its nominal value amounting to € 500 million until 2017 by use of the
effective interest method. The total amount of bonds outstanding at the
end of 2013 was € 960 million (2012: € 948 million). As in the prior year,
no commercial paper was outstanding at the end of 2013.
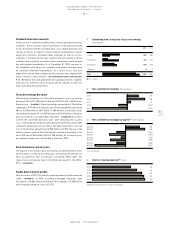
Euro dominates currency mix
The majority of our Group’s gross borrowings are denominated in euros
and US dollars. At the end of 2013, gross borrowings denominated in
euros accounted for 76% of total gross borrowings (2012: 68%). The
share of gross borrowings held in US dollars decreased to 14% (2012:
29%)
/
DIAGRAM 50.
Stable debt maturity profile
Over the course of 2013, the Group’s financing maturity profile remained
stable
/
DIAGRAM 51. In 2014, assuming unchanged maturities, debt
instruments of € 681 million will mature. This compares to € 280 million
which matured during the course of 2013.