Reebok 2013 Annual Report Download - page 148
Download and view the complete annual report
Please find page 148 of the 2013 Reebok annual report below. You can navigate through the pages in the report by either clicking on the pages listed below, or by using the keyword search tool below to find specific information within the annual report.-
 1
1 -
2
-
3
-
4
-
5
-
6
-
7
-
8
-
9
-
10
-
11
-
12
-
13
-
14
-
15
-
16
-
17
-
18
-
19
-
20
-
21
-
22
-
23
-
24
-
25
-
26
-
27
-
28
-
29
-
30
-
31
-
32
-
33
-
34
-
35
-
36
-
37
-
38
-
39
-
40
-
41
-
42
-
43
-
44
-
45
-
46
-
47
-
48
-
49
-
50
-
51
-
52
-
53
-
54
-
55
-
56
-
57
-
58
-
59
-
60
-
61
-
62
-
63
-
64
-
65
-
66
-
67
-
68
-
69
-
70
-
71
-
72
-
73
-
74
-
75
-
76
-
77
-
78
-
79
-
80
-
81
-
82
-
83
-
84
-
85
-
86
-
87
-
88
-
89
-
90
-
91
-
92
-
93
-
94
-
95
-
96
-
97
-
98
-
99
-
100
-
101
-
102
-
103
-
104
-
105
-
106
-
107
-
108
-
109
-
110
-
111
-
112
-
113
-
114
-
115
-
116
-
117
-
118
-
119
-
120
-
121
-
122
-
123
-
124
-
125
-
126
-
127
-
128
-
129
-
130
-
131
-
132
-
133
-
134
-
135
-
136
-
137
-
 138
138 -
 139
139 -
 140
140 -
 141
141 -
 142
142 -
 143
143 -
 144
144 -
 145
145 -
 146
146 -
 147
147 -
 148
148 -
 149
149 -
 150
150 -
 151
151 -
 152
152 -
 153
153 -
 154
154 -
 155
155 -
 156
156 -
 157
157 -
 158
158 -
159
-
160
-
161
-
162
-
163
-
164
-
165
-
166
-
167
-
168
-
169
-
170
-
171
-
172
-
173
-
174
-
175
-
176
-
177
-
178
-
179
-
180
-
181
-
182
-
183
-
184
-
185
-
186
-
187
-
188
-
189
-
190
-
191
-
192
-
193
-
194
-
195
-
196
-
197
-
198
-
199
-
200
-
201
-
202
-
203
-
204
-
205
-
206
-
207
-
208
-
209
-
210
-
211
-
212
-
213
-
214
-
215
-
216
-
217
-
218
-
219
-
220
-
221
-
222
-
223
-
224
-
225
-
226
-
227
-
228
-
229
-
230
-
231
-
232
-
233
-
234
-
235
-
236
-
237
-
238
-
239
-
240
-
241
-
242
-
243
-
244
-
245
-
246
-
247
-
248
-
249
-
250
-
251
-
252
-
253
-
254
-
255
-
256
-
257
-
258
-
259
-
260
-
261
-
262
-
263
-
264
 |
 |

3
adidas Group
/
2013 Annual Report
Group Management Report – Financial Review
144
2013
/
03.3
/
Business Performance by Segment
/
Wholesale Business Performance
Business Performance by Segment
The adidas Group has divided its operating activities into Wholesale, Retail and Other Businesses.
The Wholesale segment comprises the adidas and Reebok business activities with retailers. The
Retail segment comprises the own-retail and e-commerce activities of the adidas and Reebok
brands. The financial results of TaylorMade-adidas Golf, Rockport, Reebok-CCM Hockey and Other
Centrally Managed Brands, which comprise brands such as Y-3 and Five Ten, are aggregated under
Other Businesses.
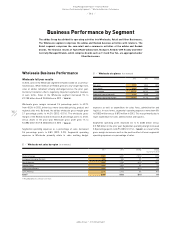
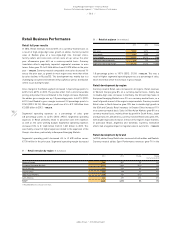
Wholesale Business Performance
Wholesale full year results
In 2013, sales in the Wholesale segment remained stable on a currency-
neutral basis. While revenues at Reebok grew at a low-single-digit rate,
sales at adidas remained virtually unchanged versus the prior year.
Currency translation effects negatively impacted segmental revenues
in euro terms. Sales in the Wholesale segment decreased 5% to
€ 9.100 billion from € 9.533 billion in 2012
/
TABLE 01.
Wholesale gross margin increased 2.4 percentage points to 42.7%
from 40.3% in 2012, driven by a more favourable pricing, product and
regional sales mix. By brand, the adidas wholesale gross margin grew
2.1 percentage points to 44.2% (2012: 42.1%). The wholesale gross
margin of the Reebok brand increased 4.8 percentage points to 31.0%
versus 26.2% in the prior year. Wholesale gross profit grew 1% to
€ 3.884 billion from € 3.840 billion in 2012
/
TABLE 01.
Segmental operating expenses as a percentage of sales decreased
0.4 percentage points to 8.8% (2012: 9.2%). Segmental operating
expenses in Wholesale primarily relate to sales working budget
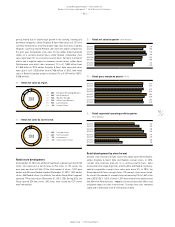
02
/
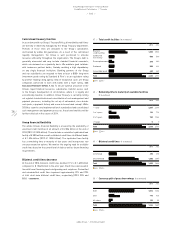
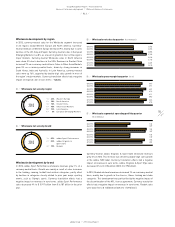
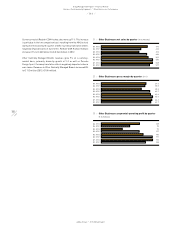
Wholesale net sales by region (€ in millions)
2013 2012 Change Change
(currency-neutral)
Western Europe 2,941 3,257 (10%) (9%)
European Emerging Markets 545 545 0% 8%
North America 1,633 1,744 (6%) (3%)
Greater China 1,403 1,322 6% 7%
Other Asian Markets 1,368 1,493 (8%) 5%
Latin America 1,210 1,172 3% 16%
Total 1) 9,100 9,533 (5%) 0%
1) Rounding differences may arise in totals.
01
/
Wholesale at a glance (€ in millions)
2013 2012 Change
Net sales 9,100 9,533 (5%)
Gross profit 3,884 3,840 1%
Gross margin 42.7% 40.3% 2.4pp
Segmental operating profit 3,082 2,965 4%
Segmental operating margin 33.9% 31.1% 2.8pp
expenses as well as expenditure for sales force, administration and
logistics. In euro terms, segmental operating expenses were down 8%
to € 802 million versus € 875 million in 2012. This was primarily due to
lower expenditure for sales administration and logistics.
Segmental operating profit improved 4% to € 3.082 billion versus
€ 2.965 billion in the prior year. Segmental operating margin increased
2.8 percentage points to 33.9% (2012: 31.1%)
/
TABLE 01, as a result of the
gross margin increase as well as the positive effect of lower segmental
operating expenses as a percentage of sales.