Reebok 2013 Annual Report Download - page 220
Download and view the complete annual report
Please find page 220 of the 2013 Reebok annual report below. You can navigate through the pages in the report by either clicking on the pages listed below, or by using the keyword search tool below to find specific information within the annual report.-
 1
1 -
2
-
3
-
4
-
5
-
6
-
7
-
8
-
9
-
10
-
11
-
12
-
13
-
14
-
15
-
16
-
17
-
18
-
19
-
20
-
21
-
22
-
23
-
24
-
25
-
26
-
27
-
28
-
29
-
30
-
31
-
32
-
33
-
34
-
35
-
36
-
37
-
38
-
39
-
40
-
41
-
42
-
43
-
44
-
45
-
46
-
47
-
48
-
49
-
50
-
51
-
52
-
53
-
54
-
55
-
56
-
57
-
58
-
59
-
60
-
61
-
62
-
63
-
64
-
65
-
66
-
67
-
68
-
69
-
70
-
71
-
72
-
73
-
74
-
75
-
76
-
77
-
78
-
79
-
80
-
81
-
82
-
83
-
84
-
85
-
86
-
87
-
88
-
89
-
90
-
91
-
92
-
93
-
94
-
95
-
96
-
97
-
98
-
99
-
100
-
101
-
102
-
103
-
104
-
105
-
106
-
107
-
108
-
109
-
110
-
111
-
112
-
113
-
114
-
115
-
116
-
117
-
118
-
119
-
120
-
121
-
122
-
123
-
124
-
125
-
126
-
127
-
128
-
129
-
130
-
131
-
132
-
133
-
134
-
135
-
136
-
137
-
138
-
139
-
140
-
141
-
142
-
143
-
144
-
145
-
146
-
147
-
148
-
149
-
150
-
151
-
152
-
153
-
154
-
155
-
156
-
157
-
158
-
159
-
160
-
161
-
162
-
163
-
164
-
165
-
166
-
167
-
168
-
169
-
170
-
171
-
172
-
173
-
174
-
175
-
176
-
177
-
178
-
179
-
180
-
181
-
182
-
183
-
184
-
185
-
186
-
187
-
188
-
189
-
190
-
191
-
192
-
193
-
194
-
195
-
196
-
197
-
198
-
199
-
200
-
201
-
202
-
203
-
204
-
205
-
206
-
207
-
208
-
209
-
 210
210 -
 211
211 -
 212
212 -
 213
213 -
 214
214 -
 215
215 -
 216
216 -
 217
217 -
 218
218 -
 219
219 -
 220
220 -
 221
221 -
 222
222 -
 223
223 -
 224
224 -
 225
225 -
 226
226 -
 227
227 -
 228
228 -
 229
229 -
 230
230 -
231
-
232
-
233
-
234
-
235
-
236
-
237
-
238
-
239
-
240
-
241
-
242
-
243
-
244
-
245
-
246
-
247
-
248
-
249
-
250
-
251
-
252
-
253
-
254
-
255
-
256
-
257
-
258
-
259
-
260
-
261
-
262
-
263
-
264
 |
 |

adidas Group
/
2013 Annual Report
Consolidated Financial Statements
216
2013
/
04.8
/
Notes
/
Notes to the Consolidated Statement of Financial Position
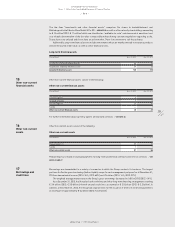
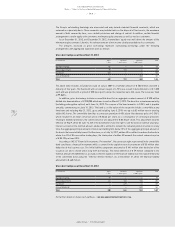
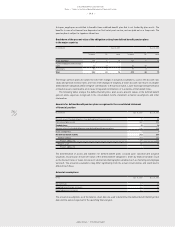
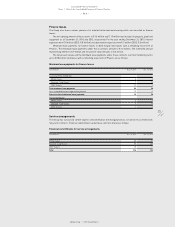
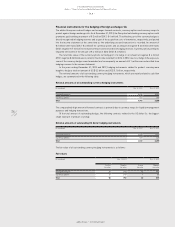
In the following table, the effects of reasonably conceivable changes in the actuarial assumptions on the present
value of the obligation from defined benefit pension plans are analysed. In addition, for Germany, UK and Japan
the average duration of the obligation is shown.
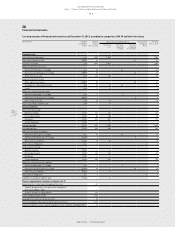
Sensitivity analysis of the obligation from defined benefit pension plans
(€ in millions) Dec. 31, 2013
Germany UK Japan
Present value of the obligation from defined benefit pension plans 224 41 14
Increase in the discount rate by 0.5% 207 35 13
Reduction in the discount rate by 0.5% 243 47 15
Average duration of the obligations (in years) 16 30 12
Since many pension plans are closed to future accrual, the salary trend plays a minor role in determining pension
obligations. Due to the fact that the benefits of the German pension plans are mainly paid as lump sums or
instalment payments, the pension increase rate and the mortality assumption have significantly less impact than
the discount rate when calculating the pension obligations.
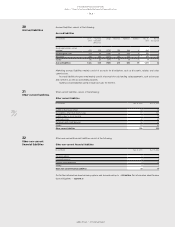
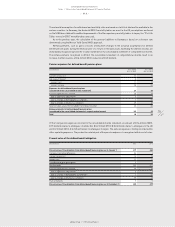
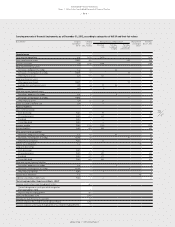
Fair value of plan assets
(€ in millions) 2013 2012
Fair value of plan assets at January 1 76 67
Currency translation differences (2) 2
Pensions paid (2) (4)
Contributions by the employer 5 4
Contributions paid by plan participants 0 0
Interest income from plan assets 3 3
Return on plan assets (not included in net interest income) 3 4
Plan settlements 0 0
Fair value of plan assets at December 31 83 76
Approximately 83% (2012: 85%) of the total plan assets are allocated to plan assets in the UK (2013: 44%, 2012:
45%), Germany (2013: 30%, 2012: 31%) and Switzerland (2013: 9%, 2012: 9%).
In the UK, the plan assets are held under trust within the pension fund. In Germany, the plan assets are
invested in insurance contracts and in a pension fund. The plan assets in Switzerland are held by a pension
foundation. The investment strategy is aligned with the structure of the pension obligations in these countries. In
the rest of the world, the plan assets consist predominantly of insurance contracts.
The expected payments for 2014 amount to € 11 million. Thereof, € 7 million relate to benefits directly paid to
pensioners by the Group companies and € 4 million to employer contributions paid into the plan assets. In 2013,
the actual return on plan assets was € 6 million (2012: € 7 million).
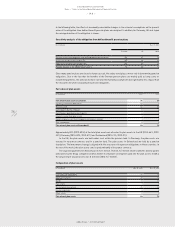
Composition of plan assets
(€ in millions) Dec. 31, 2013 Dec. 31, 2012
Cash and cash equivalents 14 13
Equity instruments 28 24
Bonds 11 10
Real estate 1 1
Pension plan reinsurance 25 24
Insurance policies 4 4
Other assets 0 0
Fair value of plan assets 83 76