Reebok 2013 Annual Report Download - page 213
Download and view the complete annual report
Please find page 213 of the 2013 Reebok annual report below. You can navigate through the pages in the report by either clicking on the pages listed below, or by using the keyword search tool below to find specific information within the annual report.-
 1
1 -
2
-
3
-
4
-
5
-
6
-
7
-
8
-
9
-
10
-
11
-
12
-
13
-
14
-
15
-
16
-
17
-
18
-
19
-
20
-
21
-
22
-
23
-
24
-
25
-
26
-
27
-
28
-
29
-
30
-
31
-
32
-
33
-
34
-
35
-
36
-
37
-
38
-
39
-
40
-
41
-
42
-
43
-
44
-
45
-
46
-
47
-
48
-
49
-
50
-
51
-
52
-
53
-
54
-
55
-
56
-
57
-
58
-
59
-
60
-
61
-
62
-
63
-
64
-
65
-
66
-
67
-
68
-
69
-
70
-
71
-
72
-
73
-
74
-
75
-
76
-
77
-
78
-
79
-
80
-
81
-
82
-
83
-
84
-
85
-
86
-
87
-
88
-
89
-
90
-
91
-
92
-
93
-
94
-
95
-
96
-
97
-
98
-
99
-
100
-
101
-
102
-
103
-
104
-
105
-
106
-
107
-
108
-
109
-
110
-
111
-
112
-
113
-
114
-
115
-
116
-
117
-
118
-
119
-
120
-
121
-
122
-
123
-
124
-
125
-
126
-
127
-
128
-
129
-
130
-
131
-
132
-
133
-
134
-
135
-
136
-
137
-
138
-
139
-
140
-
141
-
142
-
143
-
144
-
145
-
146
-
147
-
148
-
149
-
150
-
151
-
152
-
153
-
154
-
155
-
156
-
157
-
158
-
159
-
160
-
161
-
162
-
163
-
164
-
165
-
166
-
167
-
168
-
169
-
170
-
171
-
172
-
173
-
174
-
175
-
176
-
177
-
178
-
179
-
180
-
181
-
182
-
183
-
184
-
185
-
186
-
187
-
188
-
189
-
190
-
191
-
192
-
193
-
194
-
195
-
196
-
197
-
198
-
199
-
200
-
201
-
202
-
 203
203 -
 204
204 -
 205
205 -
 206
206 -
 207
207 -
 208
208 -
 209
209 -
 210
210 -
 211
211 -
 212
212 -
 213
213 -
 214
214 -
 215
215 -
 216
216 -
 217
217 -
 218
218 -
 219
219 -
 220
220 -
 221
221 -
 222
222 -
 223
223 -
224
-
225
-
226
-
227
-
228
-
229
-
230
-
231
-
232
-
233
-
234
-
235
-
236
-
237
-
238
-
239
-
240
-
241
-
242
-
243
-
244
-
245
-
246
-
247
-
248
-
249
-
250
-
251
-
252
-
253
-
254
-
255
-
256
-
257
-
258
-
259
-
260
-
261
-
262
-
263
-
264
 |
 |
adidas Group
/
2013 Annual Report
Consolidated Financial Statements
209
2013
/
04.8
/
Notes
/
Notes to the Consolidated Statement of Financial Position
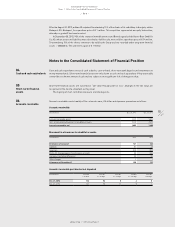
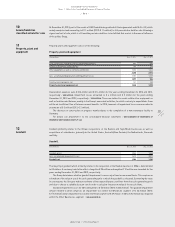
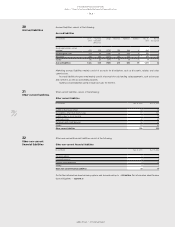
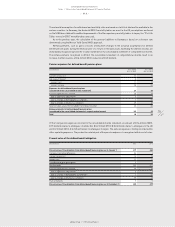
The line item “Investments and other financial assets” comprises the shares in Immobilieninvest und
Betriebsgesellschaft Herzo-Base GmbH & Co. KG
/
SEE NOTE 03 as well as other minority shareholdings amounting
to € 13 million (2012: € 11 million) which are classified as “available-for-sale” and measured at amortised cost
as a reliable determination of the fair value is impossible without having concrete negotiations regarding a sale.
These shares are unlisted and do not have an active market. There is no intention to sell these shares.
Additionally, long-term financial assets include investments which are mainly invested in insurance products
and are measured at fair value, as well as other financial assets.
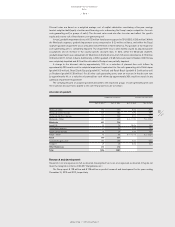
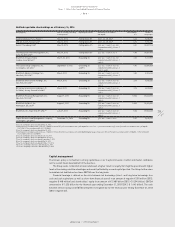
Long-term financial assets
(€ in millions) Dec. 31, 2013 Dec. 31, 2012
Investment in FC Bayern München AG 80 79
Investments and other financial assets 40 33
Long-term financial assets 120 112
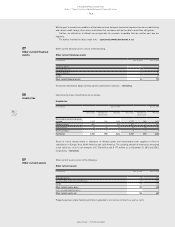
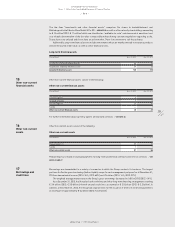
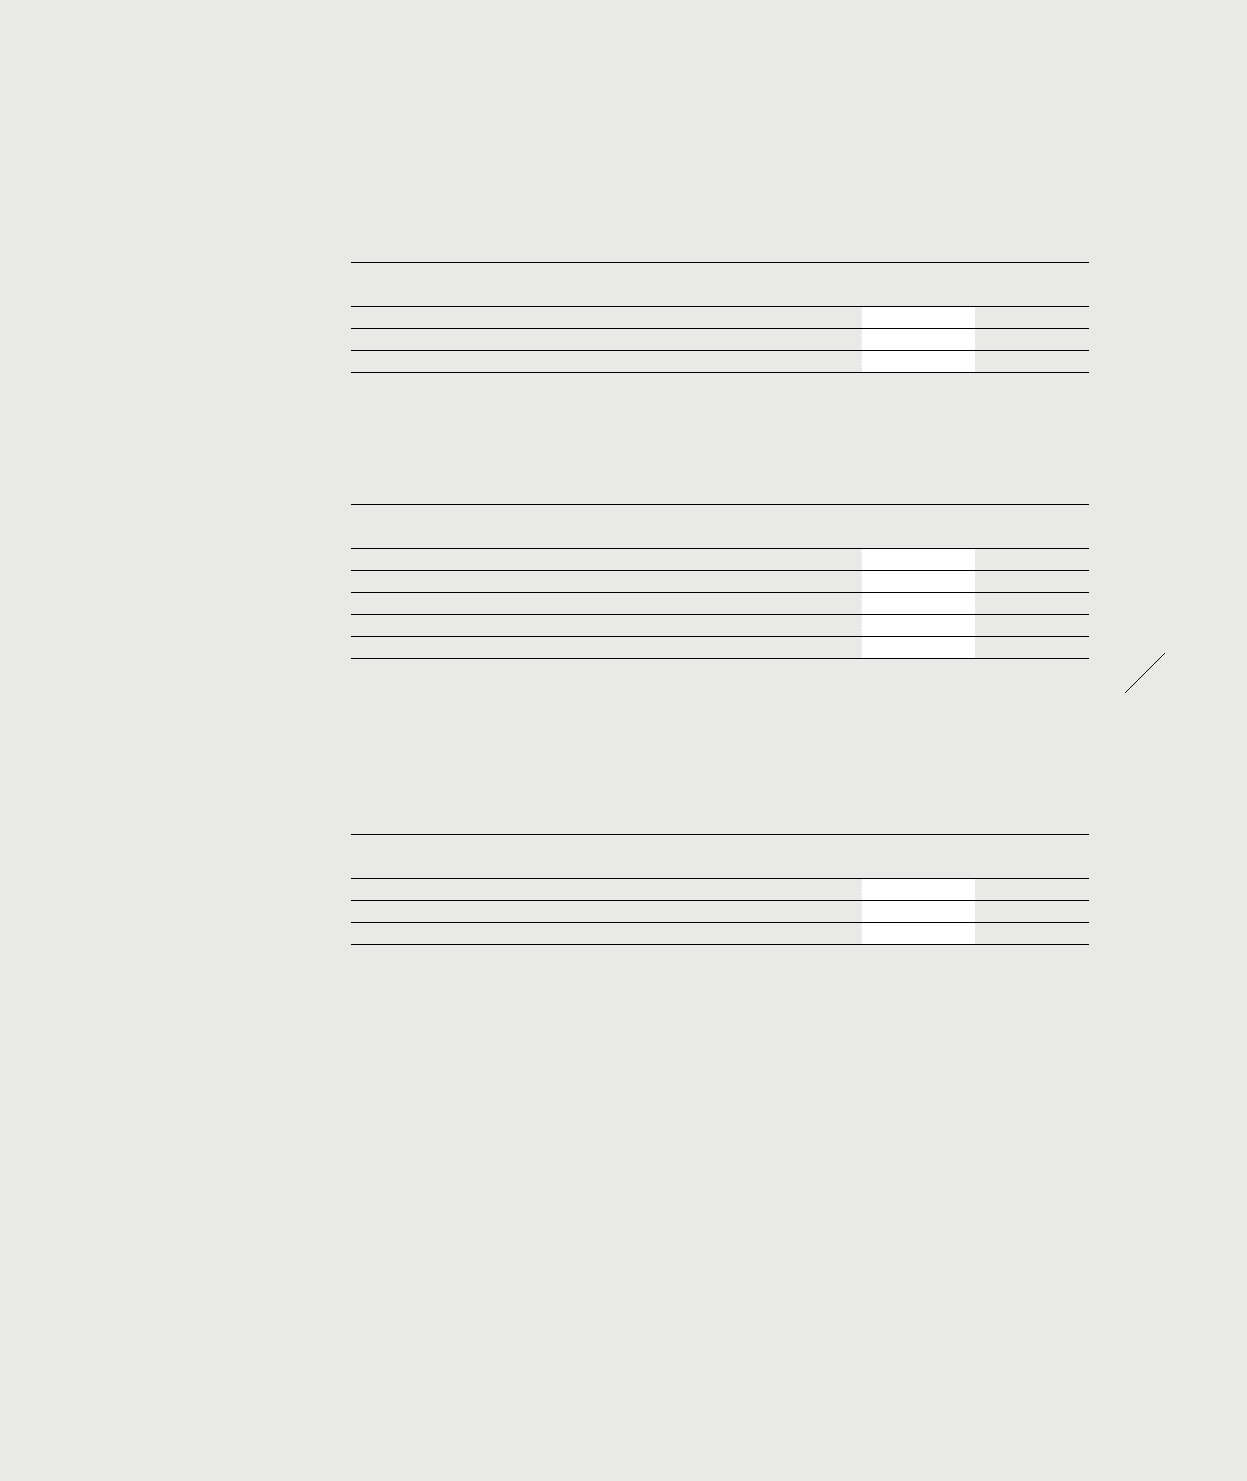
Other non-current financial assets consist of the following:
Other non-current financial assets
(€ in millions) Dec. 31, 2013 Dec. 31, 2012
Currency options 6 —
Forward contracts 0 0
Security deposits 24 20
Sundry — 1
Other non-current financial assets 30 21
For further information about currency options and forward contracts
/
SEE NOTE 28.
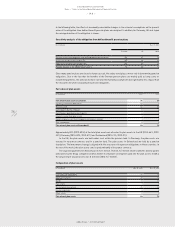
Other non-current assets consist of the following:
Other non-current assets
(€ in millions) Dec. 31, 2013 Dec. 31, 2012
Prepaid expenses 80 86
Sundry 1 0
Other non-current assets 81 86
Prepaid expenses mainly include prepayments for long-term promotional contracts and service contracts
/
SEE
NOTES 37 AND 27.
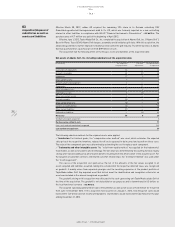
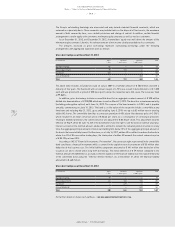
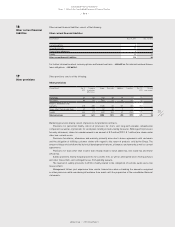
Borrowings are denominated in a variety of currencies in which the Group conducts its business. The largest
portions of effective gross borrowings (before liquidity swaps for cash management purposes) as at December 31,
2013 are denominated in euros (2013: 76%; 2012: 68%) and US dollars (2013: 14%; 2012: 29%).
The weighted average interest rate on the Group’s gross borrowings decreased to 3.8% in 2013 (2012: 4.4%).
As at December 31, 2013, the Group had cash credit lines and other long-term financing arrangements totalling
€ 3.4 billion (2012: € 3.8 billion); thereof unused credit lines accounted for € 2.0 billion (2012: € 2.3 billion). In
addition, at December 31, 2013, the Group had separate lines for the issuance of letters of credit and guarantees
in an amount of approximately € 0.2 billion (2012: € 0.2 billion).
15
Other non-current
financial assets
16
Other non-current
assets
17
Borrowings and
credit lines