Reebok 2013 Annual Report Download - page 114
Download and view the complete annual report
Please find page 114 of the 2013 Reebok annual report below. You can navigate through the pages in the report by either clicking on the pages listed below, or by using the keyword search tool below to find specific information within the annual report.-
 1
1 -
2
-
3
-
4
-
5
-
6
-
7
-
8
-
9
-
10
-
11
-
12
-
13
-
14
-
15
-
16
-
17
-
18
-
19
-
20
-
21
-
22
-
23
-
24
-
25
-
26
-
27
-
28
-
29
-
30
-
31
-
32
-
33
-
34
-
35
-
36
-
37
-
38
-
39
-
40
-
41
-
42
-
43
-
44
-
45
-
46
-
47
-
48
-
49
-
50
-
51
-
52
-
53
-
54
-
55
-
56
-
57
-
58
-
59
-
60
-
61
-
62
-
63
-
64
-
65
-
66
-
67
-
68
-
69
-
70
-
71
-
72
-
73
-
74
-
75
-
76
-
77
-
78
-
79
-
80
-
81
-
82
-
83
-
84
-
85
-
86
-
87
-
88
-
89
-
90
-
91
-
92
-
93
-
94
-
95
-
96
-
97
-
98
-
99
-
100
-
101
-
102
-
103
-
 104
104 -
 105
105 -
 106
106 -
 107
107 -
 108
108 -
 109
109 -
 110
110 -
 111
111 -
 112
112 -
 113
113 -
 114
114 -
 115
115 -
 116
116 -
 117
117 -
 118
118 -
 119
119 -
 120
120 -
 121
121 -
 122
122 -
 123
123 -
 124
124 -
125
-
126
-
127
-
128
-
129
-
130
-
131
-
132
-
133
-
134
-
135
-
136
-
137
-
138
-
139
-
140
-
141
-
142
-
143
-
144
-
145
-
146
-
147
-
148
-
149
-
150
-
151
-
152
-
153
-
154
-
155
-
156
-
157
-
158
-
159
-
160
-
161
-
162
-
163
-
164
-
165
-
166
-
167
-
168
-
169
-
170
-
171
-
172
-
173
-
174
-
175
-
176
-
177
-
178
-
179
-
180
-
181
-
182
-
183
-
184
-
185
-
186
-
187
-
188
-
189
-
190
-
191
-
192
-
193
-
194
-
195
-
196
-
197
-
198
-
199
-
200
-
201
-
202
-
203
-
204
-
205
-
206
-
207
-
208
-
209
-
210
-
211
-
212
-
213
-
214
-
215
-
216
-
217
-
218
-
219
-
220
-
221
-
222
-
223
-
224
-
225
-
226
-
227
-
228
-
229
-
230
-
231
-
232
-
233
-
234
-
235
-
236
-
237
-
238
-
239
-
240
-
241
-
242
-
243
-
244
-
245
-
246
-
247
-
248
-
249
-
250
-
251
-
252
-
253
-
254
-
255
-
256
-
257
-
258
-
259
-
260
-
261
-
262
-
263
-
264
 |
 |
adidas Group
/
2013 Annual Report
Group Management Report – Our Group
110
2013
Employees
/
02.9
/
10
/
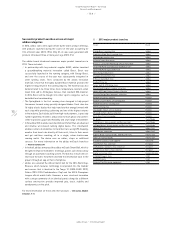
Number of employees 1)
2013 2012
Employees 2) Full-time
equivalents 3)
Employees 2) Full-time
equivalents 3)
Own retail 27,702 21,982 24,424 19,560
Sales 4,566 4,374 4,853 4,667
Logistics 6,440 5,702 5,430 4,908
Marketing 3,882 3,739 3,851 3,715
Central functions and administration 4,563 4,298 4,018 3,804
Production 1,501 1,437 1,694 1,549
Research & development 1,022 977 1,035 994
IT 1,052 1,028 1,001 970
Total 50,728 43,537 46,306 40,168
1) At year-end.
2) Number of employees on a headcount basis.
3) Number of employees on a full-time equivalent basis. Due to the high share of part-time employees in our Retail segment, this figure is lower than the number of employees counted
on a headcount basis.
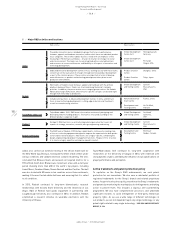
at a rate comparable to the average engagement level of our provider’s
client database. Improvements were made in specific scores relating to
performance management and learning and development opportunities.
We have set ourselves ambitious targets to improve the overall
engagement score in our 2015/2016 employee engagement survey.
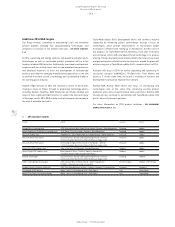
Global employee base increases strongly
On December 31, 2013, the Group had 50,728 employees, which
represents an increase of 10% versus 46,306 in the previous
year
/
DIAGRAM 07. This development is primarily related to the expansion
of the Group’s own-retail store base, particularly in European Emerging
Markets.
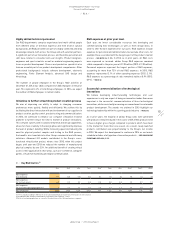
On a full-time equivalent basis, our Group had 43,537 employees on
December 31, 2013 (2012: 40,168). Due to the high share of employees
working on a part-time basis in the Retail segment, this figure is
lower than the figure reported on a headcount basis
/
TABLE 10.
Personnel expenses remained stable at € 1.876 billion in 2013 (2012:
€ 1.872 billion), representing 13% of Group sales (2012: 13%)
/
SEE
NOTE 31, P. 228.
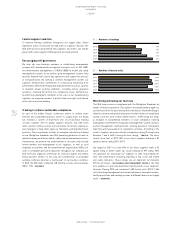
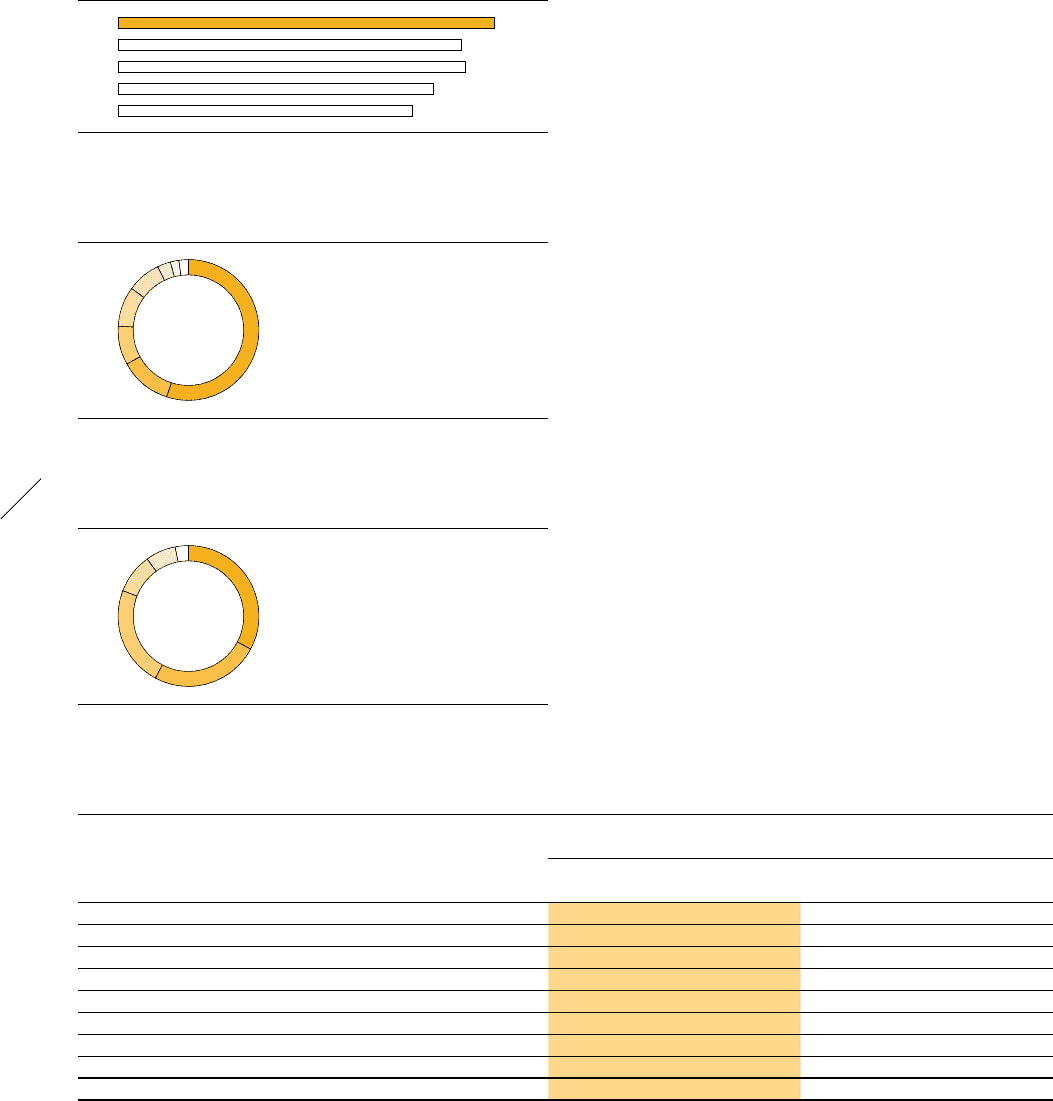
At the end of 2013, 23% of our Group’s staff were employed in Western
Europe (2012: 24%), 33% in European Emerging Markets (2012:
30%), 25% in North America (2012: 25%), 3% in Greater China (2012:
4%), 9% in Other Asian Markets (2012: 10%) and 7% in Latin America
(2012: 7%)
/
DIAGRAM 09. As a global company with less than 11% of our
employees located in Germany, we actively encourage global mobility
and offer our employees the opportunity to experience international
assignments. To support adidas Group professionals and their families
moving to new living and working environments, we provide, among
other services, relevant language and cultural training as well as
relocation assistance.
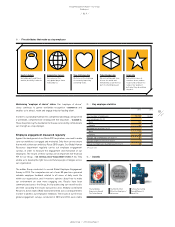
07
/
adidas Group number of employees 1)
2013 50,728
2012 46,306
2011 46,824
2010 42,541
2009 39,596
1) At year-end.
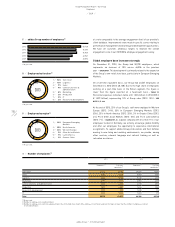
08
/
Employees by function 1)
1) At year-end.
1
/
54% Own retail
2
/
13% Logistics
3
/
9% Sales
4
/
9% Central functions &
administration
5
/
8% Marketing
6
/
3% Production
7
/
2% IT
8
/
2% Research & development
09
/
Employees by region 1)
1) At year-end.
1
/
33% European Emerging
Markets
2
/
25% North America
3
/
23% Western Europe
4
/
9% Other Asian Markets
5
/
7% Latin America
6
/
3% Greater China
2013 1
2
3
4
5 6 7 8
2013
1
2
3
6
4 5