Reebok 2013 Annual Report Download - page 129
Download and view the complete annual report
Please find page 129 of the 2013 Reebok annual report below. You can navigate through the pages in the report by either clicking on the pages listed below, or by using the keyword search tool below to find specific information within the annual report.-
 1
1 -
2
-
3
-
4
-
5
-
6
-
7
-
8
-
9
-
10
-
11
-
12
-
13
-
14
-
15
-
16
-
17
-
18
-
19
-
20
-
21
-
22
-
23
-
24
-
25
-
26
-
27
-
28
-
29
-
30
-
31
-
32
-
33
-
34
-
35
-
36
-
37
-
38
-
39
-
40
-
41
-
42
-
43
-
44
-
45
-
46
-
47
-
48
-
49
-
50
-
51
-
52
-
53
-
54
-
55
-
56
-
57
-
58
-
59
-
60
-
61
-
62
-
63
-
64
-
65
-
66
-
67
-
68
-
69
-
70
-
71
-
72
-
73
-
74
-
75
-
76
-
77
-
78
-
79
-
80
-
81
-
82
-
83
-
84
-
85
-
86
-
87
-
88
-
89
-
90
-
91
-
92
-
93
-
94
-
95
-
96
-
97
-
98
-
99
-
100
-
101
-
102
-
103
-
104
-
105
-
106
-
107
-
108
-
109
-
110
-
111
-
112
-
113
-
114
-
115
-
116
-
117
-
118
-
 119
119 -
 120
120 -
 121
121 -
 122
122 -
 123
123 -
 124
124 -
 125
125 -
 126
126 -
 127
127 -
 128
128 -
 129
129 -
 130
130 -
 131
131 -
 132
132 -
 133
133 -
 134
134 -
 135
135 -
 136
136 -
 137
137 -
 138
138 -
 139
139 -
140
-
141
-
142
-
143
-
144
-
145
-
146
-
147
-
148
-
149
-
150
-
151
-
152
-
153
-
154
-
155
-
156
-
157
-
158
-
159
-
160
-
161
-
162
-
163
-
164
-
165
-
166
-
167
-
168
-
169
-
170
-
171
-
172
-
173
-
174
-
175
-
176
-
177
-
178
-
179
-
180
-
181
-
182
-
183
-
184
-
185
-
186
-
187
-
188
-
189
-
190
-
191
-
192
-
193
-
194
-
195
-
196
-
197
-
198
-
199
-
200
-
201
-
202
-
203
-
204
-
205
-
206
-
207
-
208
-
209
-
210
-
211
-
212
-
213
-
214
-
215
-
216
-
217
-
218
-
219
-
220
-
221
-
222
-
223
-
224
-
225
-
226
-
227
-
228
-
229
-
230
-
231
-
232
-
233
-
234
-
235
-
236
-
237
-
238
-
239
-
240
-
241
-
242
-
243
-
244
-
245
-
246
-
247
-
248
-
249
-
250
-
251
-
252
-
253
-
254
-
255
-
256
-
257
-
258
-
259
-
260
-
261
-
262
-
263
-
264
 |
 |
adidas Group
/
2013 Annual Report
Group Management Report – Financial Review
125
2013
/
03.2
/
Group Business Performance
/
Income Statement
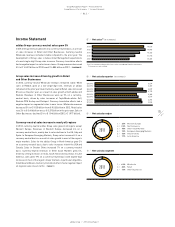
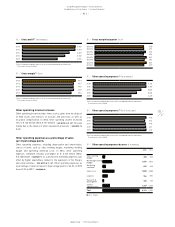
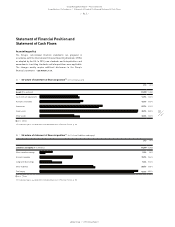
Income Statement
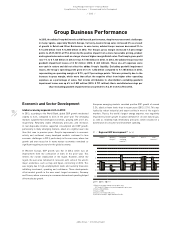
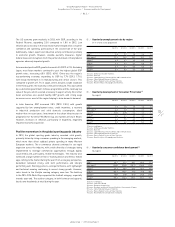
adidas Group currency-neutral sales grow 3%
In 2013, Group revenues grew 3% on a currency-neutral basis, as a result
of sales increases in Retail and Other Businesses. Currency-neutral
Wholesale revenues remained stable compared to the prior year. The
development of Group sales is below initial Management expectations
of a mid-single-digit Group sales increase. Currency translation effects
had a negative impact on sales in euro terms. Group revenues decreased
3% to € 14.492 billion in 2013 from € 14.883 billion in 2012
/
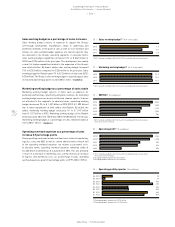
DIAGRAM 07.
Group sales increase driven by growth in Retail
and Other Businesses
In 2013, currency-neutral Wholesale revenues remained stable. While
sales at Reebok grew at a low-single-digit rate, revenues at adidas
remained at the prior year level. Currency-neutral Retail sales increased
8% versus the prior year, as a result of sales growth at both adidas and
Reebok. Revenues in Other Businesses were up 5% on a currency-
neutral basis, driven by sales increases at TaylorMade-adidas Golf,
Reebok-CCM Hockey and Rockport. Currency translation effects had a
negative impact on segmental sales in euro terms. Wholesale revenues
decreased 5% to € 9.100 billion from € 9.533 billion in 2012. Retail sales
rose 2% to € 3.446 billion versus € 3.373 billion in the prior year. Sales in
Other Businesses declined 2% to € 1.946 billion (2012: € 1.977 billion).
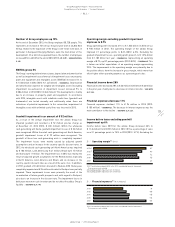
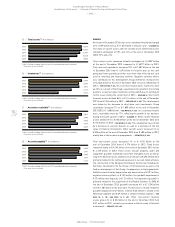
Currency-neutral sales increase in nearly all regions
In 2013, currency-neutral adidas Group sales grew in all regions except
Western Europe. Revenues in Western Europe decreased 6% on a
currency-neutral basis, mainly due to sales declines in the UK, Italy and
Spain. In European Emerging Markets, Group sales increased 4% on a
currency-neutral basis as a result of sales growth in most of the region’s
major markets. Sales for the adidas Group in North America grew 2%
on a currency-neutral basis, due to sales increases in both the USA and
Canada. Sales in Greater China increased 7% on a currency-neutral
basis. Currency-neutral revenues in Other Asian Markets grew 5%,
driven by strong increases in India, South Korea and Australia. In Latin
America, sales grew 19% on a currency-neutral basis with double-digit
increases in most of the region’s major markets, in particular Argentina,
Colombia and Mexico. Currency translation effects had a negative impact
on regional sales in euro terms
/
TABLE 11.
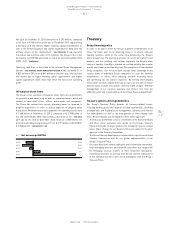
07
/
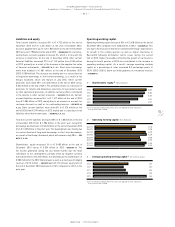
Net sales 1) (€ in millions)
2013 14,492
2012 14,883
2011 13,322
2010 11,990
2009 10,381
1) 2011 restated according to IAS 8 in the 2012 consolidated financial statements.
Prior years are not restated.
10
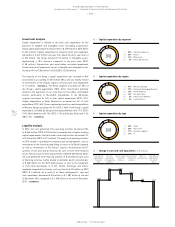
/
Net sales by segment
2013 1
/
63% Wholesale
2
/
24% Retail
3
/
13% Other Businesses
1
2
3
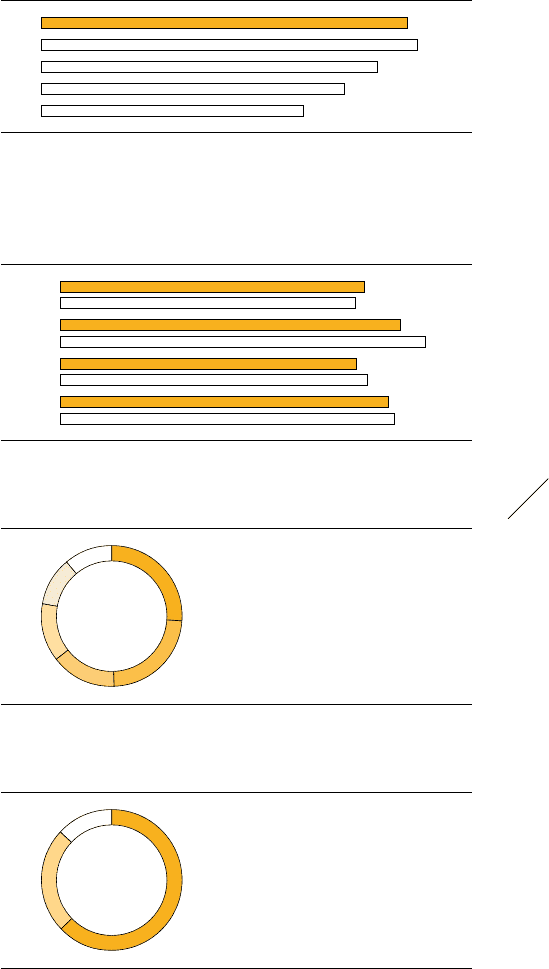
09
/
Net sales by region
2013
1
/
26% Western Europe
2
/
23% North America
3
/
15% Other Asian Markets
4
/
13% European Emerging Markets
5
/
12% Greater China
6
/
11% Latin America
6
5 1
2
3
4
08
/
Net sales by quarter (€ in millions)
Q4 2013 3,479
Q4 2012 3,369
Q3 2013 3,879
Q3 2012 4,173
Q2 2013 3,383
Q2 2012 3,517
Q1 2013 3,751
Q1 2012 3,824