Reebok 2013 Annual Report Download - page 133
Download and view the complete annual report
Please find page 133 of the 2013 Reebok annual report below. You can navigate through the pages in the report by either clicking on the pages listed below, or by using the keyword search tool below to find specific information within the annual report.-
 1
1 -
2
-
3
-
4
-
5
-
6
-
7
-
8
-
9
-
10
-
11
-
12
-
13
-
14
-
15
-
16
-
17
-
18
-
19
-
20
-
21
-
22
-
23
-
24
-
25
-
26
-
27
-
28
-
29
-
30
-
31
-
32
-
33
-
34
-
35
-
36
-
37
-
38
-
39
-
40
-
41
-
42
-
43
-
44
-
45
-
46
-
47
-
48
-
49
-
50
-
51
-
52
-
53
-
54
-
55
-
56
-
57
-
58
-
59
-
60
-
61
-
62
-
63
-
64
-
65
-
66
-
67
-
68
-
69
-
70
-
71
-
72
-
73
-
74
-
75
-
76
-
77
-
78
-
79
-
80
-
81
-
82
-
83
-
84
-
85
-
86
-
87
-
88
-
89
-
90
-
91
-
92
-
93
-
94
-
95
-
96
-
97
-
98
-
99
-
100
-
101
-
102
-
103
-
104
-
105
-
106
-
107
-
108
-
109
-
110
-
111
-
112
-
113
-
114
-
115
-
116
-
117
-
118
-
119
-
120
-
121
-
122
-
 123
123 -
 124
124 -
 125
125 -
 126
126 -
 127
127 -
 128
128 -
 129
129 -
 130
130 -
 131
131 -
 132
132 -
 133
133 -
 134
134 -
 135
135 -
 136
136 -
 137
137 -
 138
138 -
 139
139 -
 140
140 -
 141
141 -
 142
142 -
 143
143 -
144
-
145
-
146
-
147
-
148
-
149
-
150
-
151
-
152
-
153
-
154
-
155
-
156
-
157
-
158
-
159
-
160
-
161
-
162
-
163
-
164
-
165
-
166
-
167
-
168
-
169
-
170
-
171
-
172
-
173
-
174
-
175
-
176
-
177
-
178
-
179
-
180
-
181
-
182
-
183
-
184
-
185
-
186
-
187
-
188
-
189
-
190
-
191
-
192
-
193
-
194
-
195
-
196
-
197
-
198
-
199
-
200
-
201
-
202
-
203
-
204
-
205
-
206
-
207
-
208
-
209
-
210
-
211
-
212
-
213
-
214
-
215
-
216
-
217
-
218
-
219
-
220
-
221
-
222
-
223
-
224
-
225
-
226
-
227
-
228
-
229
-
230
-
231
-
232
-
233
-
234
-
235
-
236
-
237
-
238
-
239
-
240
-
241
-
242
-
243
-
244
-
245
-
246
-
247
-
248
-
249
-
250
-
251
-
252
-
253
-
254
-
255
-
256
-
257
-
258
-
259
-
260
-
261
-
262
-
263
-
264
 |
 |
adidas Group
/
2013 Annual Report
Group Management Report – Financial Review
129
2013
/
03.2
/
Group Business Performance
/
Income Statement
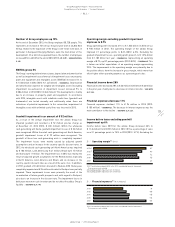
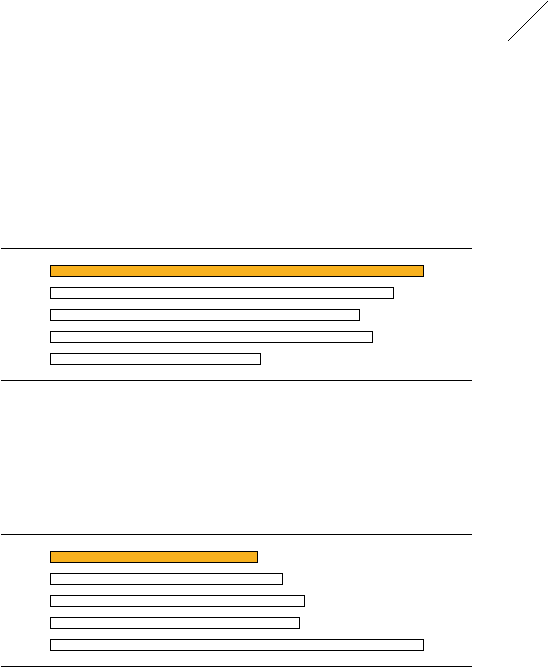
Operating margin excluding goodwill impairment
improves to 8.7%
Group operating profit increased 31% to € 1.202 billion in 2013 versus
€ 920 million in 2012. The operating margin of the adidas Group
improved 2.1 percentage points to 8.3% (2012: 6.2%). Excluding the
goodwill impairment losses, operating profit grew 6% to € 1.254 billion
from € 1.185 billion last year
/
DIAGRAM 23, representing an operating
margin of 8.7%, up 0.7 percentage points (2012: 8.0%)
/
DIAGRAM 25. This
is below our initial expectations of an operating margin approaching
9.0%. The improvement in the operating margin was primarily due to
the positive effects from the increase in gross margin, which more than
offset higher other operating expenses as a percentage of sales.
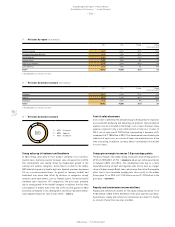
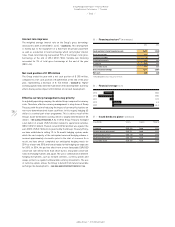
Financial income down 28%
Financial income decreased 28% to € 26 million in 2013 from € 36 million
in the prior year, mainly due to a decrease in interest income
/
SEE NOTE
32, P. 228.
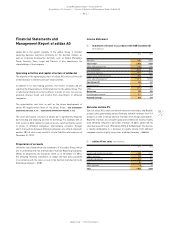
Financial expenses decrease 11%
Financial expenses declined 11% to € 94 million in 2013 (2012:
€ 105 million)
/
DIAGRAM 26. The decrease in interest expenses was the
main contributor to the decline
/
SEE NOTE 32, P. 228.
Income before taxes excluding goodwill
impairment up 6%
Income before taxes (IBT) for the adidas Group increased 33% to
€ 1.134 billion from € 851 million in 2012. IBT as a percentage of sales
rose 2.1 percentage points to 7.8% in 2013 (2012: 5.7%). Excluding the
26
/
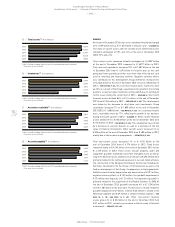
Financial expenses 1) (€ in millions)
2013 94
2012 105
2011 115
2010 113
2009 169
1) 2011 restated according to IAS 8 in the 2012 consolidated financial statements.
Prior years are not restated.
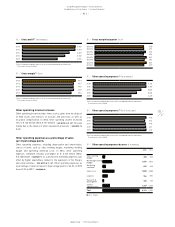
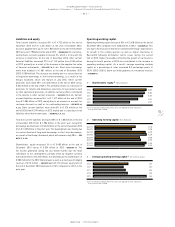
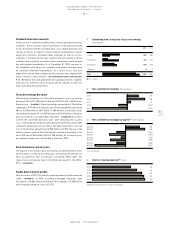
Number of Group employees up 10%
At the end of December 2013, the Group employed 50,728 people. This
represents an increase of 10% versus the prior year level of 46,306. New
hirings related to the expansion of the Group’s own-retail store base, in
particular in European Emerging Markets, were the main driver of this
development. On a full-time equivalent basis, the number of employees
increased 8% to 43,537 at the end of 2013 (2012: 40,168)
/
SEE EMPLOYEES,
P. 105.
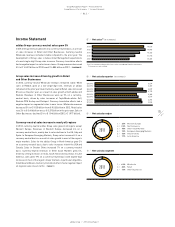
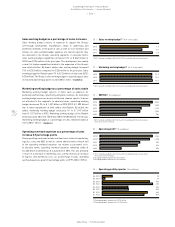
EBITDA grows 5%
The Group’s earnings before interest, taxes, depreciation and amortisation
as well as impairment losses/reversal of impairment losses on property,
plant and equipment and intangible assets (EBITDA) increased 5% to
€ 1.523 billion in 2013 (2012: € 1.445 billion)
/
DIAGRAM 22. Depreciation
and amortisation expense for tangible and intangible assets (excluding
impairment losses/reversal of impairment losses) increased 9% to
€ 286 million in 2013 (2012: € 263 million). This development is mainly
due to an increase in property, plant and equipment. In accordance
with IFRS, intangible assets with indefinite useful lives (goodwill and
trademarks) are tested annually and additionally when there are
indications of potential impairment. In this connection, impairment of
intangible assets with unlimited useful lives was incurred in 2013.
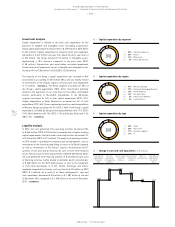
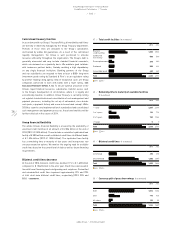
Goodwill impairment in an amount of € 52 million
As a result of the annual impairment test, the adidas Group has
impaired goodwill and recorded a € 52 million pre-tax charge as
at December 31, 2013 (2012: € 265 million). Within the wholesale
cash-generating unit Iberia, goodwill impairment losses of € 23 million
were recognised. Within the retail cash-generating unit North America,
goodwill impairment losses of € 29 million were recognised. The
goodwill of these two cash-generating units is completely impaired.
The impairment losses were mainly caused by adjusted growth
assumptions and an increase in the country-specific discount rates. In
2012, the wholesale cash-generating unit North America was impaired
by € 106 million, Latin America by € 41 million, Brazil by € 15 million
and Iberia by € 11 million. The impairment loss in 2012 was mainly the
result of adjusted growth assumptions for the Reebok brand, especially
in North America, Latin America and Brazil, and an increase in the
country-specific discount rates as a result of the euro crisis. In addition,
in 2012 goodwill of € 68 million allocated to Reebok-CCM Hockey was
completely impaired and € 24 million allocated to Rockport was partially
impaired. These impairment losses were primarily the result of the
re-evaluation of future growth prospects and, with regard to Rockport,
also due to an increase in the discount rate. The impairment losses in
both years were non-cash in nature and do not affect the adidas Group’s
liquidity
/
SEE NOTE 02, P. 195.
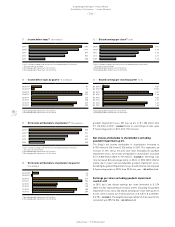
25
/
Operating margin 1) (in %)
2013 2) 8.7
2012 3) 8.0
2011 7.2
2010 7.5
2009 4.9
1) 2011 restated according to IAS 8 in the 2012 consolidated financial statements.
Prior years are not restated.
2) Excluding goodwill impairment of € 52 million.
3) Excluding goodwill impairment of € 265 million.