Reebok 2013 Annual Report Download - page 235
Download and view the complete annual report
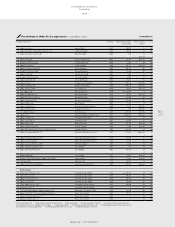
Please find page 235 of the 2013 Reebok annual report below. You can navigate through the pages in the report by either clicking on the pages listed below, or by using the keyword search tool below to find specific information within the annual report.-
 1
1 -
2
-
3
-
4
-
5
-
6
-
7
-
8
-
9
-
10
-
11
-
12
-
13
-
14
-
15
-
16
-
17
-
18
-
19
-
20
-
21
-
22
-
23
-
24
-
25
-
26
-
27
-
28
-
29
-
30
-
31
-
32
-
33
-
34
-
35
-
36
-
37
-
38
-
39
-
40
-
41
-
42
-
43
-
44
-
45
-
46
-
47
-
48
-
49
-
50
-
51
-
52
-
53
-
54
-
55
-
56
-
57
-
58
-
59
-
60
-
61
-
62
-
63
-
64
-
65
-
66
-
67
-
68
-
69
-
70
-
71
-
72
-
73
-
74
-
75
-
76
-
77
-
78
-
79
-
80
-
81
-
82
-
83
-
84
-
85
-
86
-
87
-
88
-
89
-
90
-
91
-
92
-
93
-
94
-
95
-
96
-
97
-
98
-
99
-
100
-
101
-
102
-
103
-
104
-
105
-
106
-
107
-
108
-
109
-
110
-
111
-
112
-
113
-
114
-
115
-
116
-
117
-
118
-
119
-
120
-
121
-
122
-
123
-
124
-
125
-
126
-
127
-
128
-
129
-
130
-
131
-
132
-
133
-
134
-
135
-
136
-
137
-
138
-
139
-
140
-
141
-
142
-
143
-
144
-
145
-
146
-
147
-
148
-
149
-
150
-
151
-
152
-
153
-
154
-
155
-
156
-
157
-
158
-
159
-
160
-
161
-
162
-
163
-
164
-
165
-
166
-
167
-
168
-
169
-
170
-
171
-
172
-
173
-
174
-
175
-
176
-
177
-
178
-
179
-
180
-
181
-
182
-
183
-
184
-
185
-
186
-
187
-
188
-
189
-
190
-
191
-
192
-
193
-
194
-
195
-
196
-
197
-
198
-
199
-
200
-
201
-
202
-
203
-
204
-
205
-
206
-
207
-
208
-
209
-
210
-
211
-
212
-
213
-
214
-
215
-
216
-
217
-
218
-
219
-
220
-
221
-
222
-
223
-
224
-
 225
225 -
 226
226 -
 227
227 -
 228
228 -
 229
229 -
 230
230 -
 231
231 -
 232
232 -
 233
233 -
 234
234 -
 235
235 -
 236
236 -
 237
237 -
 238
238 -
 239
239 -
 240
240 -
 241
241 -
 242
242 -
 243
243 -
 244
244 -
 245
245 -
246
-
247
-
248
-
249
-
250
-
251
-
252
-
253
-
254
-
255
-
256
-
257
-
258
-
259
-
260
-
261
-
262
-
263
-
264
 |
 |

adidas Group
/
2013 Annual Report
Consolidated Financial Statements
231
2013
/
04.8
/
Notes
/
Notes to the Consolidated Income Statement
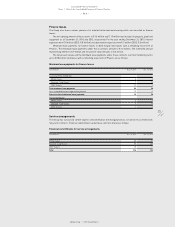
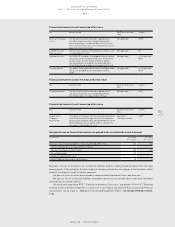
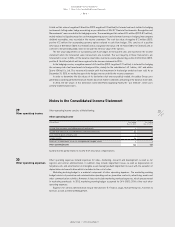
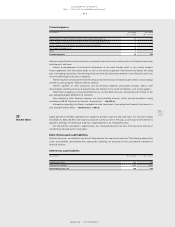
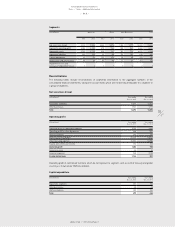
Tax expenses
Tax expenses are split as follows:
Income tax expenses
(€ in millions) Year ending
Dec. 31, 2013
Year ending
Dec. 31, 2012
Current tax expenses 358 407
Deferred tax income (14) (80)
Income tax expenses 344 327
The deferred tax income includes tax income of € 25 million in total (2012: € 60 million) related to the origination
and reversal of temporary differences.
The effective tax rate of the Group differs from an assumed tax rate of 30% for the year ending December 31,
2013 as follows:
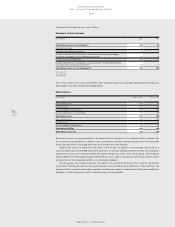
Tax rate reconciliation
Year ending Dec. 31, 2013 Year ending Dec. 31, 2012
€ in millions in % € in millions in %
Expected income tax expenses 340 30.0 255 30.0
Tax rate differentials (135) (11.9) (110) (12.9)
Non-deductible expenses 82 7.3 1 0.1
Goodwill impairment losses 16 1.4 79 9.3
Losses for which benefits were not recognisable
and changes in valuation allowances 24 2.1 53 6.2
Changes in tax rates (35) (3.1) (16) (1.9)
Other, net 1 0.1 1 0.1
293 25.9 263 30.9
Withholding tax expenses 51 4.5 64 7.5
Income tax expenses 344 30.4 327 38.4
For 2013, the line item “Non-deductible expenses” includes tax expenses of in total € 27 million related to the
resolution of domestic tax audits for prior years.
For 2013 and 2012, the effective tax rate is affected by non-tax-deductible goodwill impairment losses.
Excluding the goodwill impairment losses, the effective tax rate is 29.0% and 29.3%, respectively.
For 2013 and 2012, the line item “Changes in tax rates” mainly reflects a UK tax rate deduction effective in
2013 and 2012.
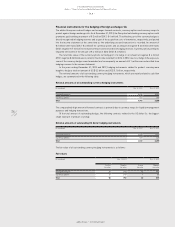
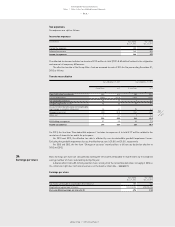
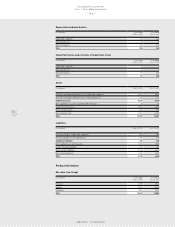
Basic earnings per share are calculated by dividing the net income attributable to shareholders by the weighted
average number of shares outstanding during the year.
A dilutive effect from 6.02 million potential shares arising from the convertible bond does not apply in 2013 as
the conversion right does not have any value as at the balance sheet date
/
SEE NOTE 17.
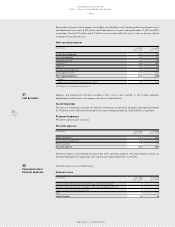
Earnings per share
Year ending
Dec. 31, 2013
Year ending
Dec. 31, 2012
Net income attributable to shareholders (€ in millions) 787 526
Weighted average number of shares 209,216,186 209,216,186
Basic and diluted earnings per share (in €) 3.76 2.52
34
Earnings per share