Reebok 2013 Annual Report Download - page 250
Download and view the complete annual report
Please find page 250 of the 2013 Reebok annual report below. You can navigate through the pages in the report by either clicking on the pages listed below, or by using the keyword search tool below to find specific information within the annual report.-
 1
1 -
2
-
3
-
4
-
5
-
6
-
7
-
8
-
9
-
10
-
11
-
12
-
13
-
14
-
15
-
16
-
17
-
18
-
19
-
20
-
21
-
22
-
23
-
24
-
25
-
26
-
27
-
28
-
29
-
30
-
31
-
32
-
33
-
34
-
35
-
36
-
37
-
38
-
39
-
40
-
41
-
42
-
43
-
44
-
45
-
46
-
47
-
48
-
49
-
50
-
51
-
52
-
53
-
54
-
55
-
56
-
57
-
58
-
59
-
60
-
61
-
62
-
63
-
64
-
65
-
66
-
67
-
68
-
69
-
70
-
71
-
72
-
73
-
74
-
75
-
76
-
77
-
78
-
79
-
80
-
81
-
82
-
83
-
84
-
85
-
86
-
87
-
88
-
89
-
90
-
91
-
92
-
93
-
94
-
95
-
96
-
97
-
98
-
99
-
100
-
101
-
102
-
103
-
104
-
105
-
106
-
107
-
108
-
109
-
110
-
111
-
112
-
113
-
114
-
115
-
116
-
117
-
118
-
119
-
120
-
121
-
122
-
123
-
124
-
125
-
126
-
127
-
128
-
129
-
130
-
131
-
132
-
133
-
134
-
135
-
136
-
137
-
138
-
139
-
140
-
141
-
142
-
143
-
144
-
145
-
146
-
147
-
148
-
149
-
150
-
151
-
152
-
153
-
154
-
155
-
156
-
157
-
158
-
159
-
160
-
161
-
162
-
163
-
164
-
165
-
166
-
167
-
168
-
169
-
170
-
171
-
172
-
173
-
174
-
175
-
176
-
177
-
178
-
179
-
180
-
181
-
182
-
183
-
184
-
185
-
186
-
187
-
188
-
189
-
190
-
191
-
192
-
193
-
194
-
195
-
196
-
197
-
198
-
199
-
200
-
201
-
202
-
203
-
204
-
205
-
206
-
207
-
208
-
209
-
210
-
211
-
212
-
213
-
214
-
215
-
216
-
217
-
218
-
219
-
220
-
221
-
222
-
223
-
224
-
225
-
226
-
227
-
228
-
229
-
230
-
231
-
232
-
233
-
234
-
235
-
236
-
237
-
238
-
239
-
 240
240 -
 241
241 -
 242
242 -
 243
243 -
 244
244 -
 245
245 -
 246
246 -
 247
247 -
 248
248 -
 249
249 -
 250
250 -
 251
251 -
 252
252 -
 253
253 -
 254
254 -
 255
255 -
 256
256 -
 257
257 -
 258
258 -
 259
259 -
 260
260 -
261
-
262
-
263
-
264
 |
 |
1
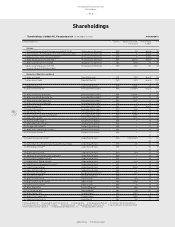
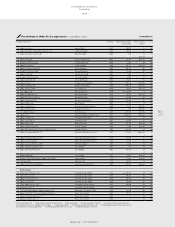
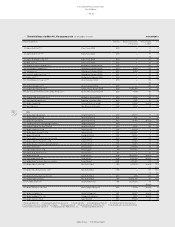
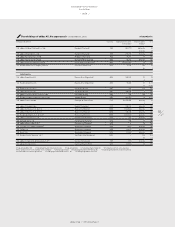
adidas Group
/
2013 Annual Report
Additional Information
246
2013
/
05.1
/
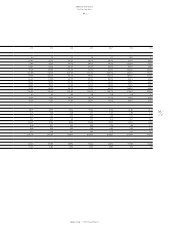
Ten-Year Overview
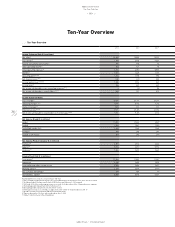
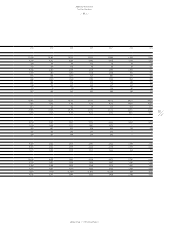
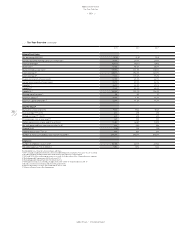
Ten-Year Overview
Rounding differences may arise in percentages and totals.
1) 2011 restated according to IAS 8 in the 2012 consolidated financial statements. Prior years are not restated.
2) Including Reebok, Rockport and Reebok-CCM Hockey from February 1, 2006 onwards.
3) 2004 and 2005 reflect continuing operations as a result of the divestiture of the Salomon business segment.
4) Excluding goodwill impairment of € 52 million in 2013.
5) Excluding goodwill impairment of € 265 million in 2012.
6) 2004 figures have been restated due to application of IAS 32/IAS 39 and amendment to IAS 19.
7) Includes income from continuing and discontinued operations.
8) Figures adjusted for 1:4 share split conducted on June 6, 2006.
9) Subject to Annual General Meeting approval.
..
/
Ten-Year Overview
2013 2012 2011 1)
Income Statement Data (€ in millions)
Net sales 3) 14,492 14,883 13,322
Gross profit 3) 7,140 7,103 6,329
Royalty and commission income 3) 104 105 93
Other operating income 3) 143 127 98
Other operating expenses 3) 6,133 6,150 5,567
EBITDA 3) 1,523 1,445 1,199
Operating profit 3) 4) 5) 1,254 1,185 953
Net financial result 3) 6) (68) (69) (84)
Income before taxes 3) 4) 5) 6) 1,186 1,116 869
Income taxes 3) 344 327 261
Net income attributable to non-controlling interests 3) 6) 3 (2) (5)
Net income attributable to shareholders 4) 5) 7) 839 791 613
Income Statement Ratios
Gross margin 3) 49.3% 47.7% 47.5%
Operating margin 3) 4) 5) 8.7% 8.0% 7.2%
Interest coverage 3) 24.5 14.6 12.2
Effective tax rate 3) 4) 5) 29.0% 29.3% 30.0%
Net income attributable to shareholders in % of net sales 4) 5) 7) 5.8% 5.3% 4.6%
Net Sales by Brand (€ in millions)
adidas 11,059 11,344 9,867
Reebok 1,599 1,667 1,940
TaylorMade-adidas Golf 1,285 1,344 1,044
Rockport 289 285 261
Reebok-CCM Hockey 260 243 210
Net Sales by Product Category (€ in millions)
Footwear 3) 6,873 6,922 6,242
Apparel 3) 5,813 6,290 5,733
Hardware 3) 1,806 1,671 1,347
Balance Sheet Data (€ in millions)
Total assets 6) 11,599 11,651 11,237
Inventories 2,634 2,486 2,502
Receivables and other current assets 2,583 2,444 2,431
Working capital 6) 2,125 2,504 1,990
Net cash/(net borrowings) 295 448 90
Shareholders’ equity 6) 5,489 5,304 5,137