Reebok 2013 Annual Report Download - page 102
Download and view the complete annual report
Please find page 102 of the 2013 Reebok annual report below. You can navigate through the pages in the report by either clicking on the pages listed below, or by using the keyword search tool below to find specific information within the annual report.-
 1
1 -
2
-
3
-
4
-
5
-
6
-
7
-
8
-
9
-
10
-
11
-
12
-
13
-
14
-
15
-
16
-
17
-
18
-
19
-
20
-
21
-
22
-
23
-
24
-
25
-
26
-
27
-
28
-
29
-
30
-
31
-
32
-
33
-
34
-
35
-
36
-
37
-
38
-
39
-
40
-
41
-
42
-
43
-
44
-
45
-
46
-
47
-
48
-
49
-
50
-
51
-
52
-
53
-
54
-
55
-
56
-
57
-
58
-
59
-
60
-
61
-
62
-
63
-
64
-
65
-
66
-
67
-
68
-
69
-
70
-
71
-
72
-
73
-
74
-
75
-
76
-
77
-
78
-
79
-
80
-
81
-
82
-
83
-
84
-
85
-
86
-
87
-
88
-
89
-
90
-
91
-
 92
92 -
 93
93 -
 94
94 -
 95
95 -
 96
96 -
 97
97 -
 98
98 -
 99
99 -
 100
100 -
 101
101 -
 102
102 -
 103
103 -
 104
104 -
 105
105 -
 106
106 -
 107
107 -
 108
108 -
 109
109 -
 110
110 -
 111
111 -
 112
112 -
113
-
114
-
115
-
116
-
117
-
118
-
119
-
120
-
121
-
122
-
123
-
124
-
125
-
126
-
127
-
128
-
129
-
130
-
131
-
132
-
133
-
134
-
135
-
136
-
137
-
138
-
139
-
140
-
141
-
142
-
143
-
144
-
145
-
146
-
147
-
148
-
149
-
150
-
151
-
152
-
153
-
154
-
155
-
156
-
157
-
158
-
159
-
160
-
161
-
162
-
163
-
164
-
165
-
166
-
167
-
168
-
169
-
170
-
171
-
172
-
173
-
174
-
175
-
176
-
177
-
178
-
179
-
180
-
181
-
182
-
183
-
184
-
185
-
186
-
187
-
188
-
189
-
190
-
191
-
192
-
193
-
194
-
195
-
196
-
197
-
198
-
199
-
200
-
201
-
202
-
203
-
204
-
205
-
206
-
207
-
208
-
209
-
210
-
211
-
212
-
213
-
214
-
215
-
216
-
217
-
218
-
219
-
220
-
221
-
222
-
223
-
224
-
225
-
226
-
227
-
228
-
229
-
230
-
231
-
232
-
233
-
234
-
235
-
236
-
237
-
238
-
239
-
240
-
241
-
242
-
243
-
244
-
245
-
246
-
247
-
248
-
249
-
250
-
251
-
252
-
253
-
254
-
255
-
256
-
257
-
258
-
259
-
260
-
261
-
262
-
263
-
264
 |
 |
adidas Group
/
2013 Annual Report
Group Management Report – Our Group
98
2013
Global Operations
/
02.7
/
06
/
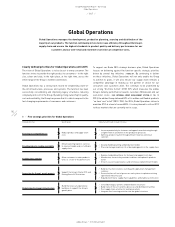
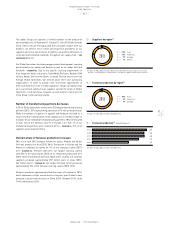
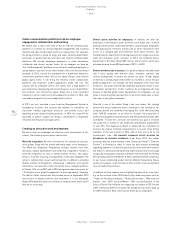
Apparel production by region 1)
1) Figures include adidas, Reebok, adidas Golf and Ashworth.
08
/
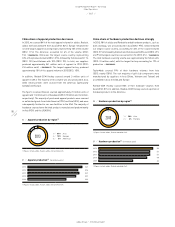
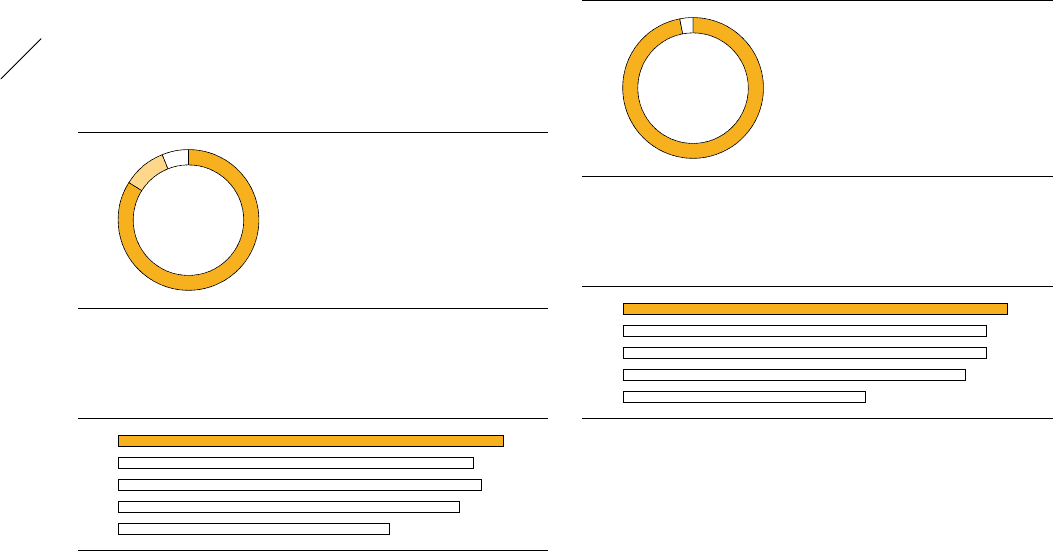
Hardware production by region 1)
1) Figures include adidas, Reebok and adidas Golf.
2013
2013
1
/
84% Asia
2
/
10% Europe
3
/
6% Americas
1
/
98% Asia
2
/
2% Europe
1
1
2
2
3
China share of apparel production decreases
In 2013, we sourced 84% of the total apparel volume for adidas, Reebok,
adidas Golf and Ashworth from Asia (2012: 84%). Europe remained the
second-largest apparel sourcing region, representing 10% of the volume
(2012: 11%). The Americas accounted for 6% of the volume (2012:
5%)
/
DIAGRAM 06. China was the largest source country, representing
33% of the produced volume (2012: 37%), followed by Indonesia with 11%
(2012: 13%) and Vietnam with 10% (2012: 9%). In total, our suppliers
produced approximately 341 million units of apparel in 2013 (2012:
314 million units)
/
DIAGRAM 07. The largest apparel factory produced
approximately 10% of this apparel volume in 2013 (2012: 10%).
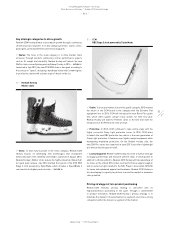
In addition, Reebok-CCM Hockey sourced around 3 million units of
apparel in 2013. The majority of this volume was also produced in Asia,
while small portions were sourced from the Americas (particularly
Canada) and Europe.
The Sports Licensed Division sourced approximately 21 million units of
apparel and 11 million units of headwear (2012: 25 million and 14 million,
respectively). The majority of purchased apparel products were sourced
as unfinished goods from Latin America (70%) and Asia (30%), and were
subsequently finished in our own facilities in the USA. The majority of
headwear sourced were finished products manufactured predominantly
in Asia (92%) and the USA (8%).
China share of hardware production declines strongly
In 2013, 98% of adidas and Reebok branded hardware products, such as
balls and bags, was also produced in Asia (2012: 97%). China remained
our largest source country, accounting for 40% of the sourced volume
(2012: 51%), followed by Vietnam and Indonesia with 20% each (2012: 21%
and 9%). European countries accounted for 2% (2012: 3%)
/
DIAGRAM 08.
The total hardware sourcing volume was approximately 54 million units
(2012: 51 million units), with the largest factory accounting for 12% of
production
/
DIAGRAM 09.
TaylorMade sourced 99% of their hardware volumes from Asia
(2012: nearly 100%). The vast majority of golf club components were
manufactured by suppliers in Asia (China, Vietnam and Taiwan) and
assembled in Asia, the USA and Europe.
Reebok-CCM Hockey sourced 86% of their hardware volumes from
Asia (2012: 81%). In addition, Reebok-CCM Hockey sourced a portion of
hardware products in the Americas.
07
/
Apparel production 1) (in million units)
2013 341
2012 314
2011 321
2010 301
2009 239
1) Figures include adidas, Reebok, adidas Golf and Ashworth.
09
/
Hardware production 1) (in million units)
2013 54
2012 51
2011 51
2010 48
2009 34
1) Figures include adidas, Reebok and adidas Golf.