Reebok 2013 Annual Report Download - page 124
Download and view the complete annual report
Please find page 124 of the 2013 Reebok annual report below. You can navigate through the pages in the report by either clicking on the pages listed below, or by using the keyword search tool below to find specific information within the annual report.-
 1
1 -
2
-
3
-
4
-
5
-
6
-
7
-
8
-
9
-
10
-
11
-
12
-
13
-
14
-
15
-
16
-
17
-
18
-
19
-
20
-
21
-
22
-
23
-
24
-
25
-
26
-
27
-
28
-
29
-
30
-
31
-
32
-
33
-
34
-
35
-
36
-
37
-
38
-
39
-
40
-
41
-
42
-
43
-
44
-
45
-
46
-
47
-
48
-
49
-
50
-
51
-
52
-
53
-
54
-
55
-
56
-
57
-
58
-
59
-
60
-
61
-
62
-
63
-
64
-
65
-
66
-
67
-
68
-
69
-
70
-
71
-
72
-
73
-
74
-
75
-
76
-
77
-
78
-
79
-
80
-
81
-
82
-
83
-
84
-
85
-
86
-
87
-
88
-
89
-
90
-
91
-
92
-
93
-
94
-
95
-
96
-
97
-
98
-
99
-
100
-
101
-
102
-
103
-
104
-
105
-
106
-
107
-
108
-
109
-
110
-
111
-
112
-
113
-
 114
114 -
 115
115 -
 116
116 -
 117
117 -
 118
118 -
 119
119 -
 120
120 -
 121
121 -
 122
122 -
 123
123 -
 124
124 -
 125
125 -
 126
126 -
 127
127 -
 128
128 -
 129
129 -
 130
130 -
 131
131 -
 132
132 -
 133
133 -
 134
134 -
135
-
136
-
137
-
138
-
139
-
140
-
141
-
142
-
143
-
144
-
145
-
146
-
147
-
148
-
149
-
150
-
151
-
152
-
153
-
154
-
155
-
156
-
157
-
158
-
159
-
160
-
161
-
162
-
163
-
164
-
165
-
166
-
167
-
168
-
169
-
170
-
171
-
172
-
173
-
174
-
175
-
176
-
177
-
178
-
179
-
180
-
181
-
182
-
183
-
184
-
185
-
186
-
187
-
188
-
189
-
190
-
191
-
192
-
193
-
194
-
195
-
196
-
197
-
198
-
199
-
200
-
201
-
202
-
203
-
204
-
205
-
206
-
207
-
208
-
209
-
210
-
211
-
212
-
213
-
214
-
215
-
216
-
217
-
218
-
219
-
220
-
221
-
222
-
223
-
224
-
225
-
226
-
227
-
228
-
229
-
230
-
231
-
232
-
233
-
234
-
235
-
236
-
237
-
238
-
239
-
240
-
241
-
242
-
243
-
244
-
245
-
246
-
247
-
248
-
249
-
250
-
251
-
252
-
253
-
254
-
255
-
256
-
257
-
258
-
259
-
260
-
261
-
262
-
263
-
264
 |
 |

adidas Group
/
2013 Annual Report
Group Management Report – Financial Review
120
2013
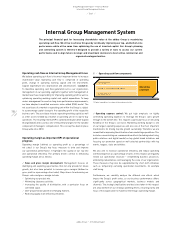
Internal Group Management System
/
03.1
/
02
/
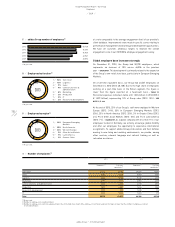
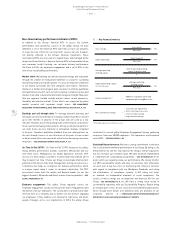
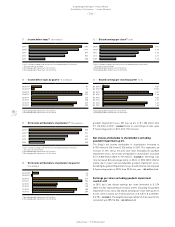
Key financial metrics
1) Excluding acquisitions and finance leases.
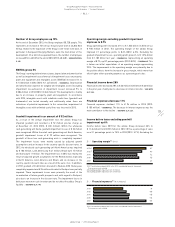
conducted its second global Employee Engagement Survey, gathering
responses from over 40,000 employees. This represents a participation
rate of 85%
/
SEE EMPLOYEES, P. 105.
Sustainability performance: We have a strong commitment to enhance
the social and environmental performance of our Group. By doing so, we
firmly believe we will not only improve the Group’s overall reputation,
but also increase our economic value. We have therefore implemented
a comprehensive sustainability programme
/
SEE SUSTAINABILITY, P. 111
under which we regularly review our performance. We closely monitor
our 2015 sustainability targets and have set ourselves clear milestones
for each year. A key focus lies on monitoring and rating our factories
with regard to compliance with our Workplace Standards and rating
the effectiveness of compliance systems. A KPI rating tool helps
us evaluate six fundamental elements of social compliance. The
results of these ratings are an important non-financial KPI for our
Group
/
SEE SUSTAINABILITY, P. 111. We have a strong track record in
sustainability reporting, with our Sustainability Progress Report being
an integral part of this. All our social and environmental publications,
which include more details and additional data, are provided on our
corporate website at :
//
WWW.ADIDAS-GROUP.COM/EN/SUSTAINABILITY/
REPORTING-POLICIES-AND-DATA/SUSTAINABILITY-REPORTS.
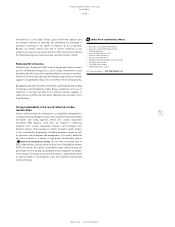
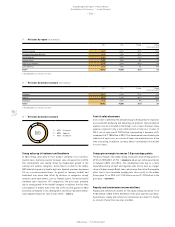
Gross margin Gross profit
= × 100
Net sales
Operating margin Operating profit
= × 100
Net sales
Average operating
working capital
Sum of operating working
capital at quarter-end
=
4
Operating working capital
in % of net sales
Average operating
working capital
= × 100
Net sales
Capital expenditure 1) = Additions of property, plant and
equipment plus intangible assets
Net cash/Net borrowings =
Cash and cash equivalents
+ short-term financial assets
– short-term borrowings
– long-term borrowings
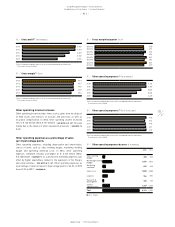
Non-financial key performance indicators (KPIs)
In addition to the Group’s financial KPIs to assess the current
performance and operational success of the adidas Group, we have
identified a set of non-financial KPIs that help us track our progress
in areas that are critical for our long-term success but are, however,
not directly reflected in the Group’s financial statements. These
non-financial KPIs are assessed on a regular basis and managed by the
respective Group functions. Key non-financial KPIs include market share
and consumer insight tracking, our customer delivery performance
(On-Time In-Full), our employee engagement and a set of KPIs in the
area of our sustainability performance.
Market share: Maintaining and enhancing brand image and reputation
through the creation of strong brand identities is crucial for sustaining
and driving revenue and profit growth. It is also an important credential
as we extend our brands into new categories and regions. Therefore,
mainly on a market and category level, we invest in primary qualitative
and quantitative research such as trend scouting, consumer surveys and
market share data to determine brand and category strength. Measures
that are regularly tracked include market shares, brand awareness,
likeability and purchase intent. These efforts are supported by global
market research and consumer insight teams
/
SEE MANAGEMENT
ASSESSMENT OF PERFORMANCE, RISKS AND OPPORTUNITIES, AND OUTLOOK, P. 180.
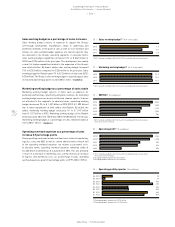
Backlogs and sell-through data: To manage demand planning and
anticipate our future performance, backlogs comprising orders received
up to nine months in advance of the actual sale are used as a key
indicator. However, due to the growing share of own retail in our business
mix as well as fluctuating order patterns among our wholesale partners,
our order books are less indicative of anticipated revenues compared
to the past. Therefore, qualitative feedback from our retail partners on
the sell-through success of our collections at the point of sale as well
as data received from our own-retail activities are becoming even more
important
/
SEE SUBSEQUENT EVENTS AND OUTLOOK, P. 151.
On-Time In-Full (OTIF): “On-Time In-Full” (OTIF) measures the adidas
Group delivery performance towards customers (Wholesale) and our
own-retail stores. Managed by our Global Operations function, OTIF
assesses to what degree customers received what they ordered and if
they received it on time. It helps our Group to investigate improvement
potential in the area of order book management and logistics processes.
It therefore also helps us to improve our delivery performance, which
is a major aspect when it comes to customer satisfaction. The OTIF
assessment covers both the adidas and Reebok brands for our two
biggest channels, Wholesale and Retail, in most of our key markets
/
SEE
GLOBAL OPERATIONS, P. 94.
Employee engagement: The adidas Group regularly carries out
employee engagement surveys to measure the level of engagement and
motivation of all our employees. The survey aims to provide key insight
into how well as a company and as leaders we are doing in engaging
our employees. It thus enables us to develop the right focus and future
people strategies across our organisation. In 2013, the adidas Group