Reebok 2013 Annual Report Download - page 153
Download and view the complete annual report
Please find page 153 of the 2013 Reebok annual report below. You can navigate through the pages in the report by either clicking on the pages listed below, or by using the keyword search tool below to find specific information within the annual report.-
 1
1 -
2
-
3
-
4
-
5
-
6
-
7
-
8
-
9
-
10
-
11
-
12
-
13
-
14
-
15
-
16
-
17
-
18
-
19
-
20
-
21
-
22
-
23
-
24
-
25
-
26
-
27
-
28
-
29
-
30
-
31
-
32
-
33
-
34
-
35
-
36
-
37
-
38
-
39
-
40
-
41
-
42
-
43
-
44
-
45
-
46
-
47
-
48
-
49
-
50
-
51
-
52
-
53
-
54
-
55
-
56
-
57
-
58
-
59
-
60
-
61
-
62
-
63
-
64
-
65
-
66
-
67
-
68
-
69
-
70
-
71
-
72
-
73
-
74
-
75
-
76
-
77
-
78
-
79
-
80
-
81
-
82
-
83
-
84
-
85
-
86
-
87
-
88
-
89
-
90
-
91
-
92
-
93
-
94
-
95
-
96
-
97
-
98
-
99
-
100
-
101
-
102
-
103
-
104
-
105
-
106
-
107
-
108
-
109
-
110
-
111
-
112
-
113
-
114
-
115
-
116
-
117
-
118
-
119
-
120
-
121
-
122
-
123
-
124
-
125
-
126
-
127
-
128
-
129
-
130
-
131
-
132
-
133
-
134
-
135
-
136
-
137
-
138
-
139
-
140
-
141
-
142
-
 143
143 -
 144
144 -
 145
145 -
 146
146 -
 147
147 -
 148
148 -
 149
149 -
 150
150 -
 151
151 -
 152
152 -
 153
153 -
 154
154 -
 155
155 -
 156
156 -
 157
157 -
 158
158 -
 159
159 -
 160
160 -
 161
161 -
 162
162 -
 163
163 -
164
-
165
-
166
-
167
-
168
-
169
-
170
-
171
-
172
-
173
-
174
-
175
-
176
-
177
-
178
-
179
-
180
-
181
-
182
-
183
-
184
-
185
-
186
-
187
-
188
-
189
-
190
-
191
-
192
-
193
-
194
-
195
-
196
-
197
-
198
-
199
-
200
-
201
-
202
-
203
-
204
-
205
-
206
-
207
-
208
-
209
-
210
-
211
-
212
-
213
-
214
-
215
-
216
-
217
-
218
-
219
-
220
-
221
-
222
-
223
-
224
-
225
-
226
-
227
-
228
-
229
-
230
-
231
-
232
-
233
-
234
-
235
-
236
-
237
-
238
-
239
-
240
-
241
-
242
-
243
-
244
-
245
-
246
-
247
-
248
-
249
-
250
-
251
-
252
-
253
-
254
-
255
-
256
-
257
-
258
-
259
-
260
-
261
-
262
-
263
-
264
 |
 |
adidas Group
/
2013 Annual Report
Group Management Report – Financial Review
149
2013
/
03.3
/
Business Performance by Segment
/
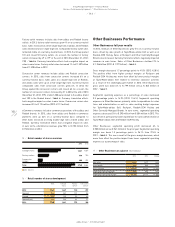
Other Businesses Performance
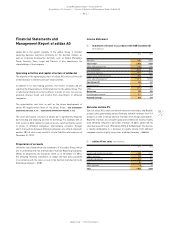
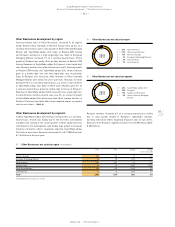
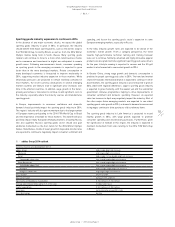
Other Businesses development by region
Currency-neutral sales of Other Businesses increased in all regions
except Greater China. Revenues in Western Europe were up 3% on a
currency-neutral basis due to sales growth at Other Centrally Managed
Brands and TaylorMade-adidas Golf. Sales at Reebok-CCM Hockey
and Rockport declined at a high-single-digit rate. Sales in European
Emerging Markets increased 1% on a currency-neutral basis. Strong
growth at Rockport was partly offset by sales declines at Reebok-CCM
Hockey. Revenues at TaylorMade-adidas Golf grew at a low-single-digit
rate. Currency-neutral sales in North America rose 6%, driven by growth
at Reebok-CCM Hockey and TaylorMade-adidas Golf, where revenues
grew at a double-digit rate and mid-single-digit rate, respectively.
Sales at Rockport also increased, while revenues at Other Centrally
Managed Brands were below the prior year level. Revenues in China
decreased 12% on a currency-neutral basis as a result of sales declines
at TaylorMade-adidas Golf. Sales in Other Asian Markets grew 5% on
a currency-neutral basis, driven by double-digit increases at Rockport.
Revenues at TaylorMade-adidas Golf increased at a low-single-digit rate.
In Latin America, currency-neutral sales rose 2%, as a result of growth
at TaylorMade-adidas Golf, which more than offset revenue declines at
Rockport. Currency translation effects had a negative impact on regional
sales in euro terms
/
TABLE 20.
Other Businesses development by segment
In 2013, TaylorMade-adidas Golf revenues increased 3% on a currency-
neutral basis. Growth was mainly due to the first-time consolidation
of Adams Golf starting in the second quarter of 2012. adidas Golf also
contributed to this development, with double-digit growth in footwear.
Currency translation effects negatively impacted TaylorMade-adidas
Golf sales in euro terms. Revenues decreased 4% to € 1.285 billion from
€ 1.344 billion in the prior year.
Rockport revenues increased 6% on a currency-neutral basis, mainly
due to sales growth related to Rockport’s lightweight concepts.
Currency translation effects negatively impacted sales in euro terms.
Revenues in the Rockport segment increased 1% to € 289 million (2012:
€ 285 million).
20
/
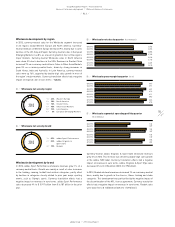
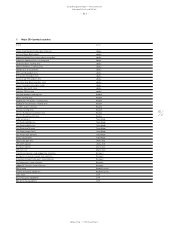
Other Businesses net sales by region (€ in millions)
2013 2012 Change Change
(currency-neutral)
Western Europe 314 312 1% 3%
European Emerging Markets 52 55 (7%) 1%
North America 1,091 1,067 2% 6%
Greater China 36 42 (13%) (12%)
Other Asian Markets 432 478 (10%) 5%
Latin America 21 22 (4%) 2%
Total 1) 1,946 1,977 (2%) 5%
1) Rounding differences may arise in totals.
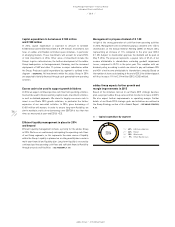
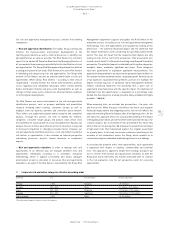
19
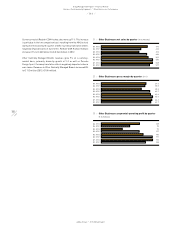
/
Other Businesses net sales by segment
1
/
66% TaylorMade-adidas Golf
2
/
15% Rockport
3
/
13% Reebok-CCM Hockey
4
/
6% Other Centrally Managed
Brands
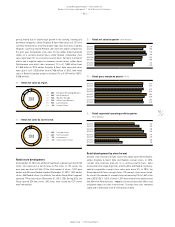
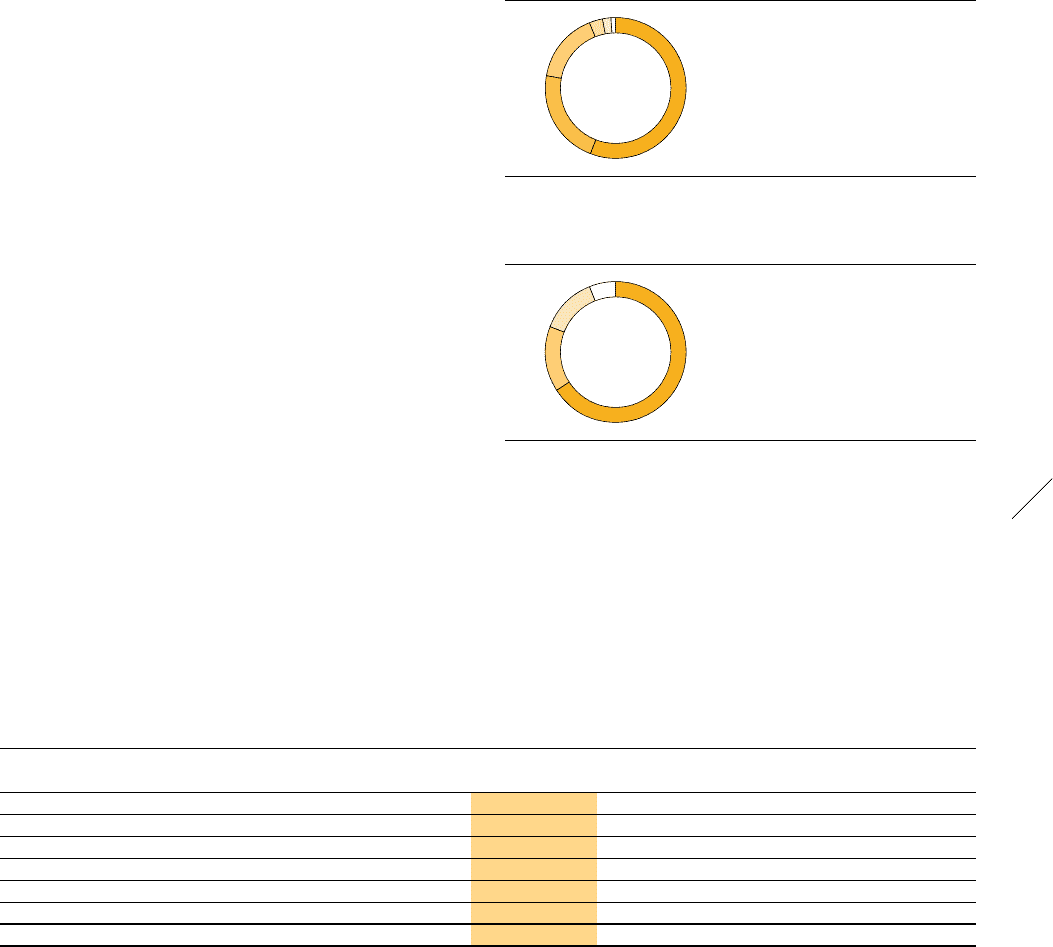
18
/
Other Businesses net sales by region
1
/
56% North America
2
/
22% Other Asian Markets
3
/
16% Western Europe
4
/
3% European Emerging Markets
5
/
2% Greater China
6
/
1% Latin America
2013
1
2
3
2013
6
5
1
2
3
4
4