Reebok 2013 Annual Report Download - page 151
Download and view the complete annual report
Please find page 151 of the 2013 Reebok annual report below. You can navigate through the pages in the report by either clicking on the pages listed below, or by using the keyword search tool below to find specific information within the annual report.-
 1
1 -
2
-
3
-
4
-
5
-
6
-
7
-
8
-
9
-
10
-
11
-
12
-
13
-
14
-
15
-
16
-
17
-
18
-
19
-
20
-
21
-
22
-
23
-
24
-
25
-
26
-
27
-
28
-
29
-
30
-
31
-
32
-
33
-
34
-
35
-
36
-
37
-
38
-
39
-
40
-
41
-
42
-
43
-
44
-
45
-
46
-
47
-
48
-
49
-
50
-
51
-
52
-
53
-
54
-
55
-
56
-
57
-
58
-
59
-
60
-
61
-
62
-
63
-
64
-
65
-
66
-
67
-
68
-
69
-
70
-
71
-
72
-
73
-
74
-
75
-
76
-
77
-
78
-
79
-
80
-
81
-
82
-
83
-
84
-
85
-
86
-
87
-
88
-
89
-
90
-
91
-
92
-
93
-
94
-
95
-
96
-
97
-
98
-
99
-
100
-
101
-
102
-
103
-
104
-
105
-
106
-
107
-
108
-
109
-
110
-
111
-
112
-
113
-
114
-
115
-
116
-
117
-
118
-
119
-
120
-
121
-
122
-
123
-
124
-
125
-
126
-
127
-
128
-
129
-
130
-
131
-
132
-
133
-
134
-
135
-
136
-
137
-
138
-
139
-
140
-
 141
141 -
 142
142 -
 143
143 -
 144
144 -
 145
145 -
 146
146 -
 147
147 -
 148
148 -
 149
149 -
 150
150 -
 151
151 -
 152
152 -
 153
153 -
 154
154 -
 155
155 -
 156
156 -
 157
157 -
 158
158 -
 159
159 -
 160
160 -
 161
161 -
162
-
163
-
164
-
165
-
166
-
167
-
168
-
169
-
170
-
171
-
172
-
173
-
174
-
175
-
176
-
177
-
178
-
179
-
180
-
181
-
182
-
183
-
184
-
185
-
186
-
187
-
188
-
189
-
190
-
191
-
192
-
193
-
194
-
195
-
196
-
197
-
198
-
199
-
200
-
201
-
202
-
203
-
204
-
205
-
206
-
207
-
208
-
209
-
210
-
211
-
212
-
213
-
214
-
215
-
216
-
217
-
218
-
219
-
220
-
221
-
222
-
223
-
224
-
225
-
226
-
227
-
228
-
229
-
230
-
231
-
232
-
233
-
234
-
235
-
236
-
237
-
238
-
239
-
240
-
241
-
242
-
243
-
244
-
245
-
246
-
247
-
248
-
249
-
250
-
251
-
252
-
253
-
254
-
255
-
256
-
257
-
258
-
259
-
260
-
261
-
262
-
263
-
264
 |
 |
adidas Group
/
2013 Annual Report
Group Management Report – Financial Review
147
2013
/
03.3
/
Business Performance by Segment
/
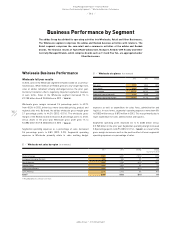
Retail Business Performance
period, mainly due to double-digit growth in the training, running and
basketball categories. adidas Originals & Sport Style sales rose 12% on a
currency-neutral basis, driven by double-digit sales increases at adidas
Originals. Currency-neutral Reebok sales were 3% higher compared to
the prior year. Comparable store sales for the adidas brand remained
stable on a currency-neutral basis, while Reebok comparable store
sales were down 3% on a currency-neutral basis. Currency translation
effects had a negative impact on revenues in euro terms. adidas Sport
Performance own-retail sales increased 1% to € 1.868 billion from
€ 1.848 billion in 2012. adidas Originals & Sport Style own-retail sales
were up 6% to € 1.020 billion from € 958 million in 2012. Own-retail
sales of Reebok branded products declined 2% to € 549 million (2012:
€ 558 million).
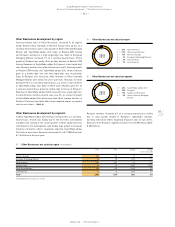
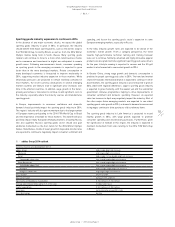
Retail store development
At December 31, 2013, the adidas Group Retail segment operated 2,740
stores. This represents a net increase of 294 stores or 12% versus the
prior year-end level of 2,446. Of the total number of stores, 1,557 were
adidas and 404 were Reebok branded (December 31, 2012: 1,353 adidas
stores, 363 Reebok stores). In addition, the adidas Group Retail segment
operated 779 factory outlets (December 31, 2012: 730). During 2013, the
Group opened 534 new stores, 240 stores were closed and 127 stores
were remodelled.
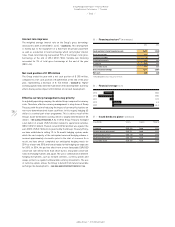
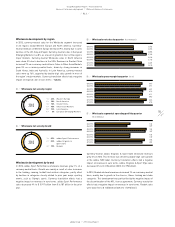
11
/
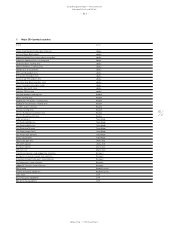
Retail net sales by store format
1
/
46% Concept stores
2
/
44% Factory outlets
3
/
7% eCommerce
4
/
3% Concession corners
10
/
Retail net sales by region
1
/
38% European Emerging Markets
2
/
18% North America
3
/
16% Western Europe
4
/
12% Other Asian Markets
5
/
10% Latin America
6
/
6% Greater China
2013 1
2
3 4
2013
6
5
1
2
3
4
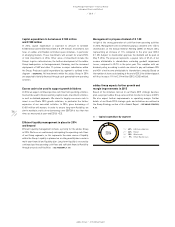
Retail development by store format
Concept store revenues include sales from adidas Sport Performance,
adidas Originals & Sport Style and Reebok concept stores. In 2013,
concept store revenues grew 6% on a currency-neutral basis. Sales
increased at mid-single-digit rates at both adidas and Reebok. Currency-
neutral comparable concept store sales were down 2%. In 2013, the
Group opened 349 new concept stores, 125 concept stores were closed.
As a result, the number of concept stores increased by 224 to 1,661 at the
end of 2013 (2012: 1,437), of which 1,357 were related to the adidas brand
and 304 to the Reebok brand
/
TABLE 16. Currency translation effects had
a negative impact on sales in euro terms. Concept store sales remained
stable at € 1.573 billion from € 1.575 billion in 2012.
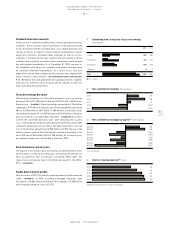
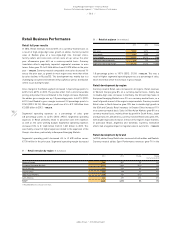
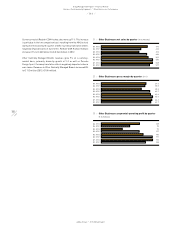
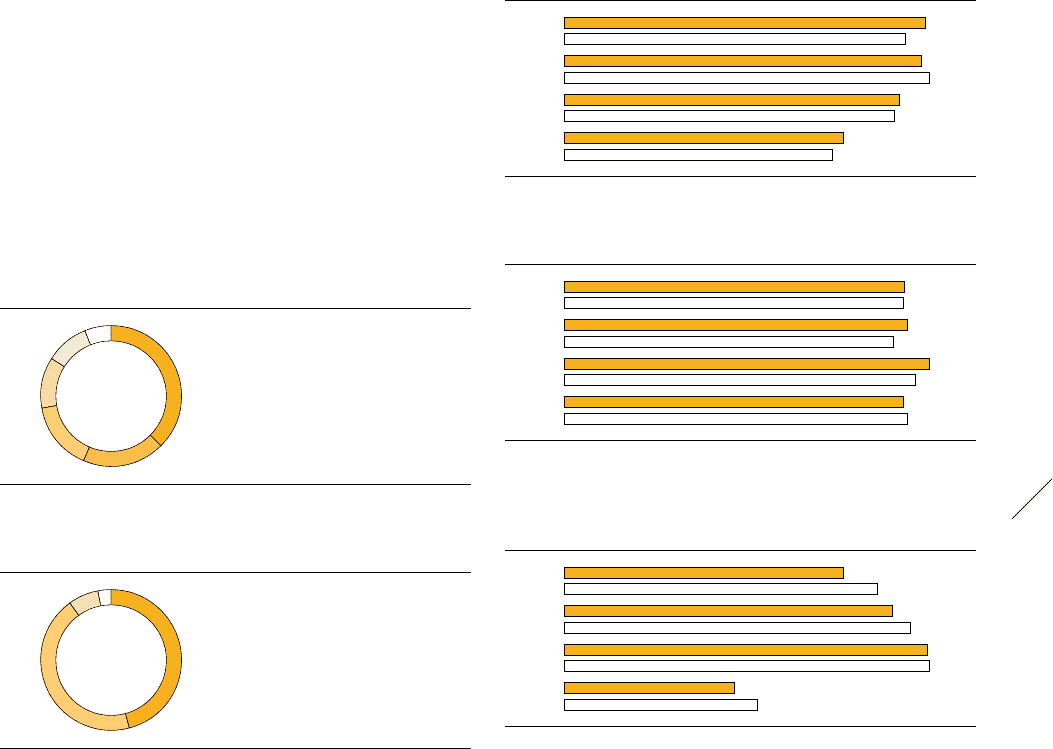
12
/
Retail net sales by quarter (€ in millions)
Q4 2013 934
Q4 2012 882
Q3 2013 923
Q3 2012 944
Q2 2013 867
Q2 2012 854
Q1 2013 722
Q1 2012 693
13
/
Retail gross margin by quarter (in %)
Q4 2013 61.0
Q4 2012 60.7
Q3 2013 61.5
Q3 2012 59.0
Q2 2013 65.4
Q2 2012 62.8
Q1 2013 60.7
Q1 2012 61.5
14
/
Retail segmental operating profit by quarter
(€ in millions)
Q4 2013 166
Q4 2012 186
Q3 2013 195
Q3 2012 206
Q2 2013 216
Q2 2012 217
Q1 2013 101
Q1 2012 115