Reebok 2013 Annual Report Download - page 134
Download and view the complete annual report
Please find page 134 of the 2013 Reebok annual report below. You can navigate through the pages in the report by either clicking on the pages listed below, or by using the keyword search tool below to find specific information within the annual report.-
 1
1 -
2
-
3
-
4
-
5
-
6
-
7
-
8
-
9
-
10
-
11
-
12
-
13
-
14
-
15
-
16
-
17
-
18
-
19
-
20
-
21
-
22
-
23
-
24
-
25
-
26
-
27
-
28
-
29
-
30
-
31
-
32
-
33
-
34
-
35
-
36
-
37
-
38
-
39
-
40
-
41
-
42
-
43
-
44
-
45
-
46
-
47
-
48
-
49
-
50
-
51
-
52
-
53
-
54
-
55
-
56
-
57
-
58
-
59
-
60
-
61
-
62
-
63
-
64
-
65
-
66
-
67
-
68
-
69
-
70
-
71
-
72
-
73
-
74
-
75
-
76
-
77
-
78
-
79
-
80
-
81
-
82
-
83
-
84
-
85
-
86
-
87
-
88
-
89
-
90
-
91
-
92
-
93
-
94
-
95
-
96
-
97
-
98
-
99
-
100
-
101
-
102
-
103
-
104
-
105
-
106
-
107
-
108
-
109
-
110
-
111
-
112
-
113
-
114
-
115
-
116
-
117
-
118
-
119
-
120
-
121
-
122
-
123
-
 124
124 -
 125
125 -
 126
126 -
 127
127 -
 128
128 -
 129
129 -
 130
130 -
 131
131 -
 132
132 -
 133
133 -
 134
134 -
 135
135 -
 136
136 -
 137
137 -
 138
138 -
 139
139 -
 140
140 -
 141
141 -
 142
142 -
 143
143 -
 144
144 -
145
-
146
-
147
-
148
-
149
-
150
-
151
-
152
-
153
-
154
-
155
-
156
-
157
-
158
-
159
-
160
-
161
-
162
-
163
-
164
-
165
-
166
-
167
-
168
-
169
-
170
-
171
-
172
-
173
-
174
-
175
-
176
-
177
-
178
-
179
-
180
-
181
-
182
-
183
-
184
-
185
-
186
-
187
-
188
-
189
-
190
-
191
-
192
-
193
-
194
-
195
-
196
-
197
-
198
-
199
-
200
-
201
-
202
-
203
-
204
-
205
-
206
-
207
-
208
-
209
-
210
-
211
-
212
-
213
-
214
-
215
-
216
-
217
-
218
-
219
-
220
-
221
-
222
-
223
-
224
-
225
-
226
-
227
-
228
-
229
-
230
-
231
-
232
-
233
-
234
-
235
-
236
-
237
-
238
-
239
-
240
-
241
-
242
-
243
-
244
-
245
-
246
-
247
-
248
-
249
-
250
-
251
-
252
-
253
-
254
-
255
-
256
-
257
-
258
-
259
-
260
-
261
-
262
-
263
-
264
 |
 |
adidas Group
/
2013 Annual Report
Group Management Report – Financial Review
130
2013
/
03.2
/
Group Business Performance
/
Income Statement
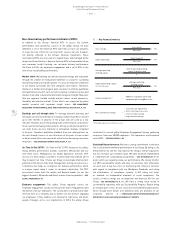
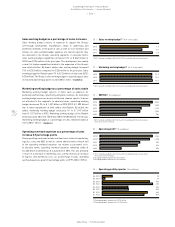
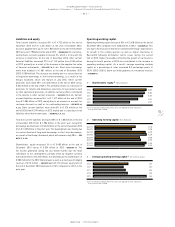
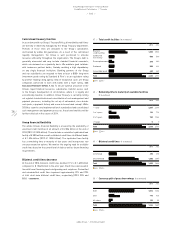
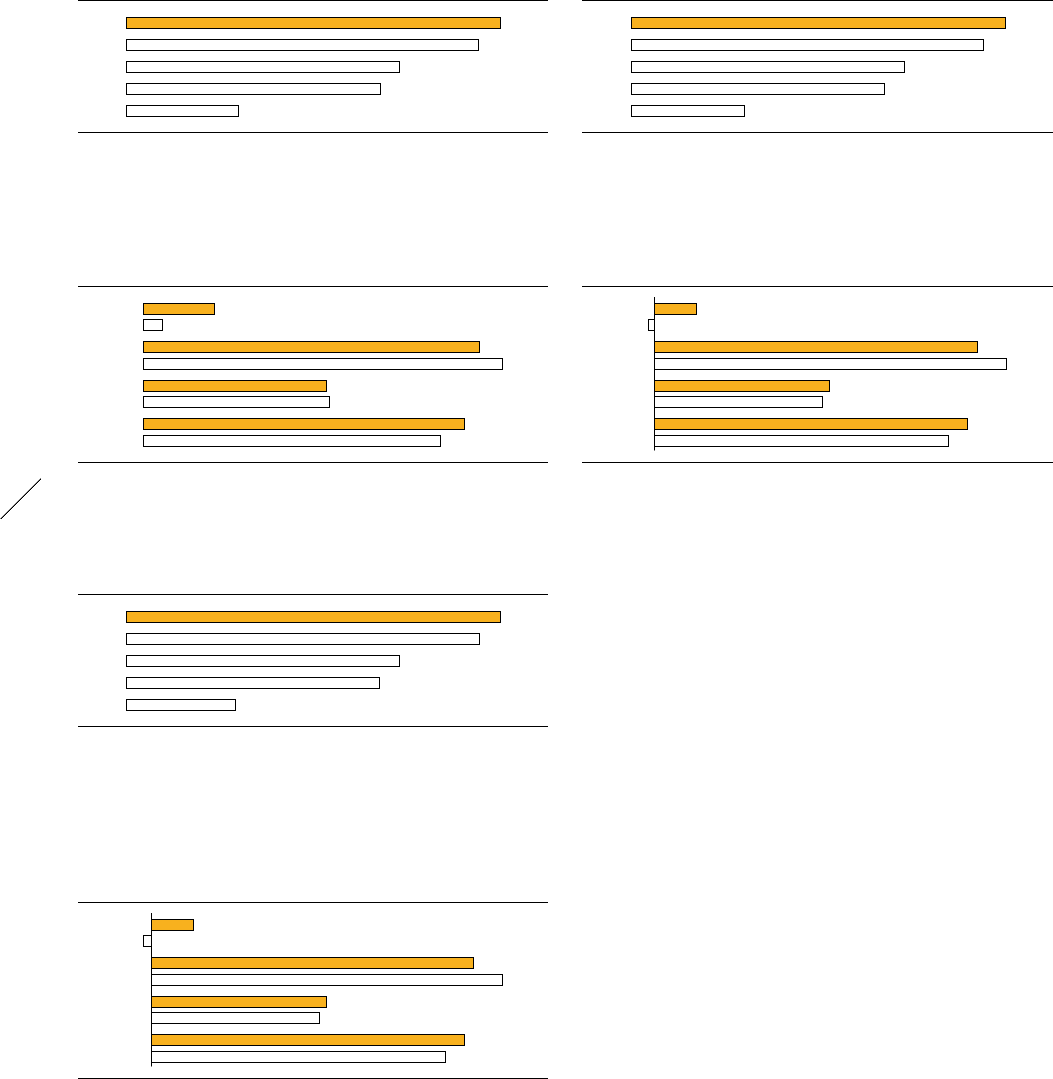
30
/
Net income attributable to shareholders by quarter
(€ in millions)
Q4 2013 1) 42
Q4 2012 2) (7)
Q3 2013 316
Q3 2012 344
Q2 2013 172
Q2 2012 165
Q1 2013 308
Q1 2012 289
1) Excluding goodwill impairment of € 52 million.
2) Excluding goodwill impairment of € 265 million.
32
/
Diluted earnings per share by quarter (in €)
Q4 2013 1) 0.20
Q4 2012 2) (0.03)
Q3 2013 1.51
Q3 2012 1.64
Q2 2013 0.82
Q2 2012 0.79
Q1 2013 1.47
Q1 2012 1.38
1) Excluding goodwill impairment of € 52 million.
2) Excluding goodwill impairment of € 265 million.
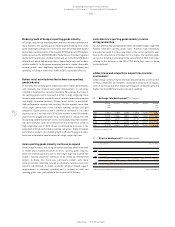
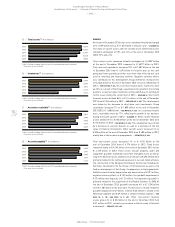
goodwill impairment losses, IBT was up 6% to € 1.186 billion from
€ 1.116 billion in 2012
/
DIAGRAM 27 and, as a percentage of sales, grew
0.7 percentage points to 8.2% from 7.5% last year.
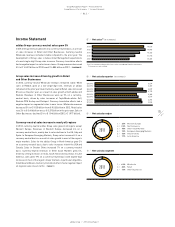
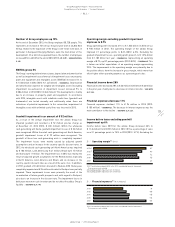
Net income attributable to shareholders excluding
goodwill impairment up 6%
The Group’s net income attributable to shareholders increased to
€ 787 million in 2013 from € 526 million in 2012. This represents an
increase of 49% versus the prior year level. Excluding the goodwill
impairment losses, net income attributable to shareholders increased
6% to € 839 million (2012: € 791 million)
/
DIAGRAM 29. The Group’s tax
rate decreased 8.0 percentage points to 30.4% in 2013 (2012: 38.4%),
mainly due to lower non-tax-deductible goodwill impairment losses.
Excluding the goodwill impairment losses, the effective tax rate improved
0.3 percentage points to 29.0% from 29.3% last year
/
SEE NOTE 33, P. 229.
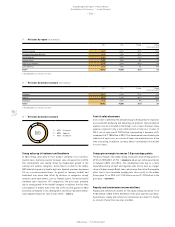
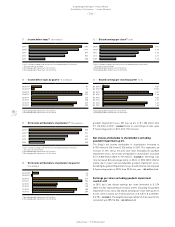
Earnings per share excluding goodwill impairment
reach € 4.01
In 2013, basic and diluted earnings per share amounted to € 3.76
(2012: € 2.52), representing an increase of 49%. Excluding the goodwill
impairment losses, basic and diluted earnings per share were up 6% to
€ 4.01, which is below our initial projections of € 4.25 to € 4.40 (2012:
€ 3.78)
/
DIAGRAM 31. The weighted average number of shares used in the
calculation was 209,216,186
/
SEE NOTE 34, P. 231.
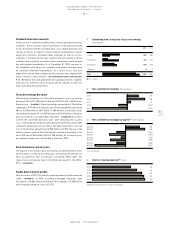
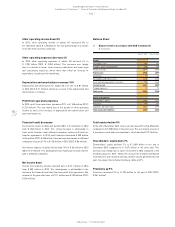
27
/
Income before taxes 1) (€ in millions)
2013 2) 1,186
2012 3) 1,116
2011 869
2010 806
2009 358
1) 2011 restated according to IAS 8 in the 2012 consolidated financial statements.
Prior years are not restated.
2) Excluding goodwill impairment of € 52 million.
3) Excluding goodwill impairment of € 265 million.
29
/
Net income attributable to shareholders 1) (€ in millions)
2013 2) 839
2012 3) 791
2011 613
2010 567
2009 245
1) 2011 restated according to IAS 8 in the 2012 consolidated financial statements.
Prior years are not restated.
2) Excluding goodwill impairment of € 52 million.
3) Excluding goodwill impairment of € 265 million.
31
/
Diluted earnings per share 1) (in €)
2013 2) 4.01
2012 3) 3.78
2011 2.93
2010 2.71
2009 1.22
1) 2011 restated according to IAS 8 in the 2012 consolidated financial statements.
Prior years are not restated.
2) Excluding goodwill impairment of € 52 million.
3) Excluding goodwill impairment of € 265 million.
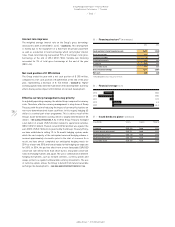
28
/
Income before taxes by quarter (€ in millions)
Q4 2013 1) 81
Q4 2012 2) 12
Q3 2013 442
Q3 2012 479
Q2 2013 236
Q2 2012 235
Q1 2013 427
Q1 2012 389
1) Excluding goodwill impairment of € 52 million.
2) Excluding goodwill impairment of € 265 million.