Reebok 2013 Annual Report Download - page 105
Download and view the complete annual report
Please find page 105 of the 2013 Reebok annual report below. You can navigate through the pages in the report by either clicking on the pages listed below, or by using the keyword search tool below to find specific information within the annual report.-
 1
1 -
2
-
3
-
4
-
5
-
6
-
7
-
8
-
9
-
10
-
11
-
12
-
13
-
14
-
15
-
16
-
17
-
18
-
19
-
20
-
21
-
22
-
23
-
24
-
25
-
26
-
27
-
28
-
29
-
30
-
31
-
32
-
33
-
34
-
35
-
36
-
37
-
38
-
39
-
40
-
41
-
42
-
43
-
44
-
45
-
46
-
47
-
48
-
49
-
50
-
51
-
52
-
53
-
54
-
55
-
56
-
57
-
58
-
59
-
60
-
61
-
62
-
63
-
64
-
65
-
66
-
67
-
68
-
69
-
70
-
71
-
72
-
73
-
74
-
75
-
76
-
77
-
78
-
79
-
80
-
81
-
82
-
83
-
84
-
85
-
86
-
87
-
88
-
89
-
90
-
91
-
92
-
93
-
94
-
 95
95 -
 96
96 -
 97
97 -
 98
98 -
 99
99 -
 100
100 -
 101
101 -
 102
102 -
 103
103 -
 104
104 -
 105
105 -
 106
106 -
 107
107 -
 108
108 -
 109
109 -
 110
110 -
 111
111 -
 112
112 -
 113
113 -
 114
114 -
 115
115 -
116
-
117
-
118
-
119
-
120
-
121
-
122
-
123
-
124
-
125
-
126
-
127
-
128
-
129
-
130
-
131
-
132
-
133
-
134
-
135
-
136
-
137
-
138
-
139
-
140
-
141
-
142
-
143
-
144
-
145
-
146
-
147
-
148
-
149
-
150
-
151
-
152
-
153
-
154
-
155
-
156
-
157
-
158
-
159
-
160
-
161
-
162
-
163
-
164
-
165
-
166
-
167
-
168
-
169
-
170
-
171
-
172
-
173
-
174
-
175
-
176
-
177
-
178
-
179
-
180
-
181
-
182
-
183
-
184
-
185
-
186
-
187
-
188
-
189
-
190
-
191
-
192
-
193
-
194
-
195
-
196
-
197
-
198
-
199
-
200
-
201
-
202
-
203
-
204
-
205
-
206
-
207
-
208
-
209
-
210
-
211
-
212
-
213
-
214
-
215
-
216
-
217
-
218
-
219
-
220
-
221
-
222
-
223
-
224
-
225
-
226
-
227
-
228
-
229
-
230
-
231
-
232
-
233
-
234
-
235
-
236
-
237
-
238
-
239
-
240
-
241
-
242
-
243
-
244
-
245
-
246
-
247
-
248
-
249
-
250
-
251
-
252
-
253
-
254
-
255
-
256
-
257
-
258
-
259
-
260
-
261
-
262
-
263
-
264
 |
 |

adidas Group
/
2013 Annual Report
Group Management Report – Our Group
101
2013
Research and Development
/
02.8
/
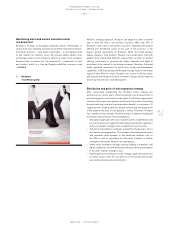
Highly skilled technical personnel
Our R&D departments comprise experienced and multi-skilled people
from different areas of technical expertise and from diverse cultural
backgrounds. All R&D personnel are part of a highly connected and deep
knowledge network, both across the Group and with external partners.
A significant part of our innovation process, and therefore personnel and
skill base, relates to consumer and user insights. Product designers,
engineers and sport scientists as well as material engineering experts
focus on product development. Process and production specialists also
form an essential part of our product development competencies. Other
professional backgrounds include software development, electronic
engineering, Finite Element Analysis, advanced CAD design and
kinesiology.
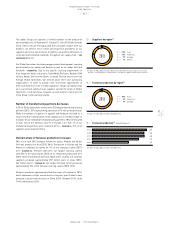
The number of people employed in the Group’s R&D activities at
December 31, 2013, was 1,022, compared to 1,035 employees in the prior
year. This represents 2% of total Group employees. In 2014, we expect
the number of R&D employees to remain stable.
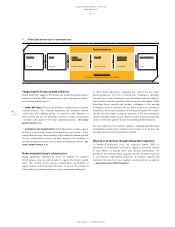
Initiatives to further streamline product creation process
We aim at improving our ability to adapt to changing consumer
preferences more quickly, flexibly and efficiently. We achieve this by
facilitating the direct interaction with and involvement of our suppliers in
product creation, quality control, product testing and commercialisation.
In 2013, we continued to enhance our computer simulation research
platform to further reduce the time to market of product innovations.
This software system, with its advanced material and design capabilities,
allows for more creativity in the design phase and significantly improves
the level of product detailing. While increasing speed and reducing the
need for physical product samples and testing in the R&D process,
the benefits also translate into other Group commercial and efficiency
initiatives. Advanced 3-D models contributed to the Group’s cross-
functional virtualisation project, where since 2010, when this project
began, until year-end 2013 we reduced the number of manufactured
physical samples by over 23%. An additional benefit of creating virtual
assets is their application in other areas, such as e-commerce, computer
games, virtual merchandising and digital communication.
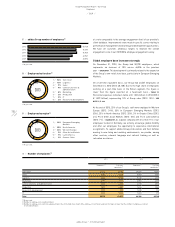
R&D expenses at prior year level
Each year, we invest considerable resources into developing and
commercialising new technologies as well as fresh design ideas, in
order to offer the best experience for our users. R&D expenses include
expenses for personnel and administration, but exclude other costs, for
example those associated with the design aspect of the product creation
process
/
SEE NOTE 02, P. 195. In 2013, as in prior years, all R&D costs
were expensed as incurred. adidas Group R&D expenses remained
stable compared to the prior year at € 128 million (2012: € 128 million).
Personnel expenses represent the largest portion of R&D expenses,
accounting for more than 72% of total R&D expenses. In 2013, R&D
expenses represented 2.1% of other operating expenses (2012: 2.1%).
R&D expenses as a percentage of sales remained stable at 0.9% (2012:
0.9%)
/
TABLE 02.
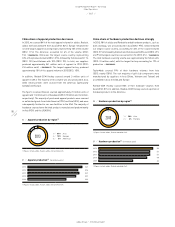
Successful commercialisation of technological
innovations
We believe developing industry-leading technologies and user
experiences is only one aspect of being an innovation leader. Even more
important is the successful commercialisation of those technological
innovations, while consistently increasing our commitment to sustainable
product development. The awards we attained in 2013 highlight our
technology leadership within the sporting goods industry
/
TABLE 04.
As in prior years, the majority of adidas Group sales were generated
with products newly introduced in the course of 2013. New products tend
to have a higher gross margin compared to products which have been
in the market for more than one season. As a result, newly launched
products contributed over-proportionately to the Group’s net income
in 2013. We expect this development to continue in 2014 as our launch
schedule includes a full pipeline of innovative products
/
SEE SUBSEQUENT
EVENTS AND OUTLOOK, P. 151.
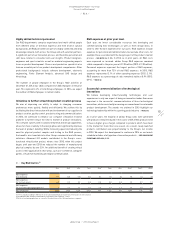
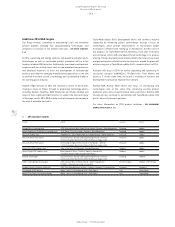
02
/
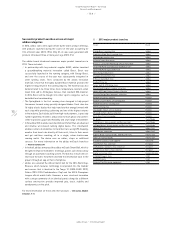
Key R&D metrics 1)
2013 2012 2011 2010 2009 2008 2007 2006 2) 2005 3) 2004 3)
R&D expenses
(€ in millions) 128 128 115 102 86 81 84 98 63 59
R&D expenses
(in % of net sales) 0.9 0.9 0.9 0.8 0.8 0.8 0.8 1.0 0.9 1.0
R&D expenses
(in % of other operating expenses) 2.1 2.1 2.1 2.0 2.0 1.9 2.1 2.6 2.5 2.6
R&D employees 1,022 1,035 1,029 1,002 999 1,152 976 1,040 636 595
1) 2011 restated according to IAS 8 in the 2012 consolidated financial statements. Prior years are not restated.
2) Including Reebok, Rockport and Reebok-CCM Hockey from February 1, 2006.
3) Reflects continuing operations as a result of the divestiture of the Salomon business segment.