Reebok 2013 Annual Report Download - page 150
Download and view the complete annual report
Please find page 150 of the 2013 Reebok annual report below. You can navigate through the pages in the report by either clicking on the pages listed below, or by using the keyword search tool below to find specific information within the annual report.-
 1
1 -
2
-
3
-
4
-
5
-
6
-
7
-
8
-
9
-
10
-
11
-
12
-
13
-
14
-
15
-
16
-
17
-
18
-
19
-
20
-
21
-
22
-
23
-
24
-
25
-
26
-
27
-
28
-
29
-
30
-
31
-
32
-
33
-
34
-
35
-
36
-
37
-
38
-
39
-
40
-
41
-
42
-
43
-
44
-
45
-
46
-
47
-
48
-
49
-
50
-
51
-
52
-
53
-
54
-
55
-
56
-
57
-
58
-
59
-
60
-
61
-
62
-
63
-
64
-
65
-
66
-
67
-
68
-
69
-
70
-
71
-
72
-
73
-
74
-
75
-
76
-
77
-
78
-
79
-
80
-
81
-
82
-
83
-
84
-
85
-
86
-
87
-
88
-
89
-
90
-
91
-
92
-
93
-
94
-
95
-
96
-
97
-
98
-
99
-
100
-
101
-
102
-
103
-
104
-
105
-
106
-
107
-
108
-
109
-
110
-
111
-
112
-
113
-
114
-
115
-
116
-
117
-
118
-
119
-
120
-
121
-
122
-
123
-
124
-
125
-
126
-
127
-
128
-
129
-
130
-
131
-
132
-
133
-
134
-
135
-
136
-
137
-
138
-
139
-
 140
140 -
 141
141 -
 142
142 -
 143
143 -
 144
144 -
 145
145 -
 146
146 -
 147
147 -
 148
148 -
 149
149 -
 150
150 -
 151
151 -
 152
152 -
 153
153 -
 154
154 -
 155
155 -
 156
156 -
 157
157 -
 158
158 -
 159
159 -
 160
160 -
161
-
162
-
163
-
164
-
165
-
166
-
167
-
168
-
169
-
170
-
171
-
172
-
173
-
174
-
175
-
176
-
177
-
178
-
179
-
180
-
181
-
182
-
183
-
184
-
185
-
186
-
187
-
188
-
189
-
190
-
191
-
192
-
193
-
194
-
195
-
196
-
197
-
198
-
199
-
200
-
201
-
202
-
203
-
204
-
205
-
206
-
207
-
208
-
209
-
210
-
211
-
212
-
213
-
214
-
215
-
216
-
217
-
218
-
219
-
220
-
221
-
222
-
223
-
224
-
225
-
226
-
227
-
228
-
229
-
230
-
231
-
232
-
233
-
234
-
235
-
236
-
237
-
238
-
239
-
240
-
241
-
242
-
243
-
244
-
245
-
246
-
247
-
248
-
249
-
250
-
251
-
252
-
253
-
254
-
255
-
256
-
257
-
258
-
259
-
260
-
261
-
262
-
263
-
264
 |
 |
adidas Group
/
2013 Annual Report
Group Management Report – Financial Review
146
2013
/
03.3
/
Business Performance by Segment
/
Retail Business Performance
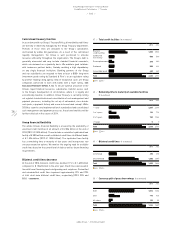
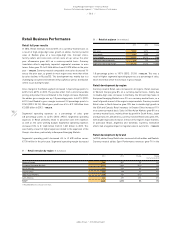
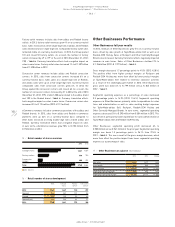
Retail Business Performance
Retail full year results
In 2013, Retail revenues increased 8% on a currency-neutral basis as
a result of high-single-digit sales growth at adidas. Currency-neutral
sales at Reebok grew at a low-single-digit rate. Concept stores,
factory outlets and concession corners were all up versus the prior
year. eCommerce grew 64% on a currency-neutral basis. Currency
translation effects negatively impacted segmental revenues in euro
terms. Sales grew 2% to € 3.446 billion from € 3.373 billion in the prior
year
/
TABLE 08. Currency-neutral comparable store sales decreased 1%
versus the prior year, as growth in most regions was more than offset
by sales declines in Russia/CIS. This development was mainly due to a
challenging consumer environment in Russia/CIS as well as distribution
centre issues during the year.
Gross margin in the Retail segment increased 1.3 percentage points to
62.2% from 60.9% in 2012. The positive effect from a more favourable
pricing and product mix contributed to the margin increase. By brand,
the adidas gross margin was up 1.0 percentage points to 63.1% (2012:
62.1%) and Reebok’s gross margin increased 2.3 percentage points to
57.4% (2012: 55.1%). Retail gross profit rose 4% to € 2.143 billion from
€ 2.055 billion in 2012
/
TABLE 08.
Segmental operating expenses as a percentage of sales grew
3.0 percentage points to 42.5% (2012: 39.5%). Segmental operating
expenses in Retail primarily relate to personnel and rent expenses
as well as the sales working budget. Segmental operating expenses
increased 10% to € 1.465 billion from € 1.331 billion in 2012. This
was mainly a result of higher expenses related to the expansion of the
Group’s store base, particularly in European Emerging Markets.
Segmental operating profit decreased 6% to € 678 million versus
€ 724 million in the prior year. Segmental operating margin decreased
1.8 percentage points to 19.7% (2012: 21.5%)
/
TABLE 08. This was a
result of higher segmental operating expenses as a percentage of sales,
which more than offset the increase in gross margin.
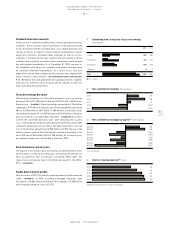
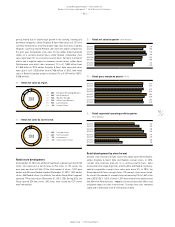
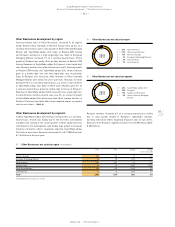
Retail development by region
Currency-neutral Retail sales increased in all regions. Retail revenues
in Western Europe grew 8% on a currency-neutral basis, mainly due
to double-digit sales increases in Germany, the UK and Italy. Sales in
European Emerging Markets rose 2% on a currency-neutral basis, as a
result of growth in most of the region’s major markets. Currency-neutral
Retail sales in North America grew 10% due to double-digit growth in
the USA and Canada. Retail revenues in Greater China increased 11%
on a currency-neutral basis. Sales in Other Asian Markets grew 8% on a
currency-neutral basis, mainly driven by growth in South Korea, Japan
and Australia. In Latin America, currency-neutral Retail sales grew 31%,
with double-digit sales increases in most of the region’s major markets,
in particular Brazil, Argentina and Colombia. Currency translation
effects had a negative impact on regional sales in euro terms
/
TABLE 09.
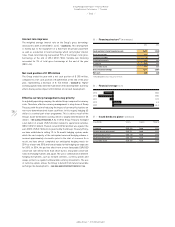
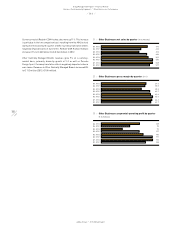
Retail development by brand
In 2013, adidas Group Retail sales increased at both adidas and Reebok.
Currency-neutral adidas Sport Performance revenues grew 7% in the
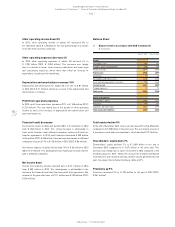
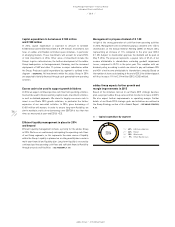
08
/
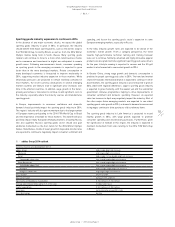
Retail at a glance (€ in millions)
2013 2012 Change
Net sales 3,446 3,373 2%
Gross profit 2,143 2,055 4%
Gross margin 62.2% 60.9% 1.3pp
Segmental operating profit 678 724 (6%)
Segmental operating margin 19.7% 21.5% (1.8pp)
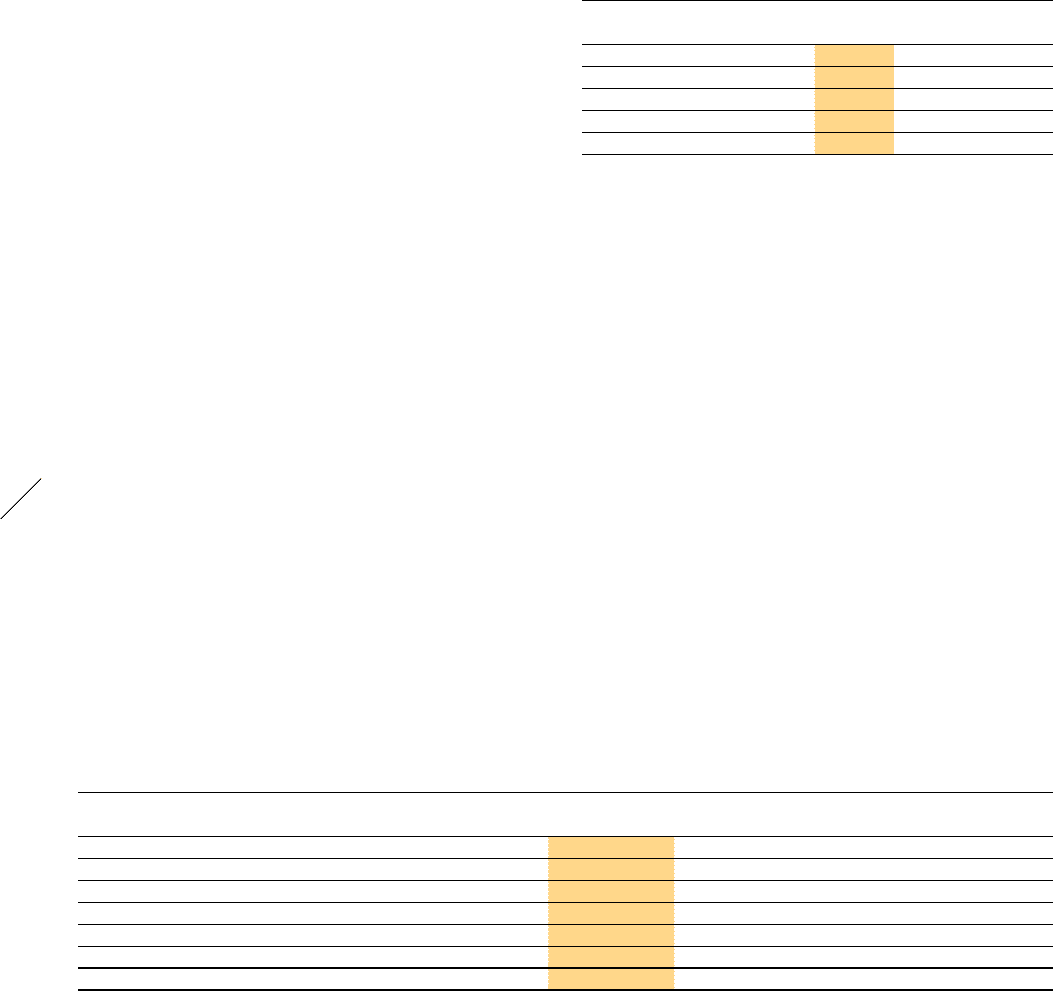
09
/
Retail net sales by region (€ in millions)
2013 2012 Change Change
(currency-neutral)
Western Europe 544 507 7% 8%
European Emerging Markets 1,297 1,346 (4%) 2%
North America 639 599 7% 10%
Greater China 216 198 9% 11%
Other Asian Markets 406 436 (7%) 8%
Latin America 344 287 20% 31%
Total 1) 3,446 3,373 2% 8%
1) Rounding differences may arise in totals.