Reebok 2013 Annual Report Download - page 223
Download and view the complete annual report
Please find page 223 of the 2013 Reebok annual report below. You can navigate through the pages in the report by either clicking on the pages listed below, or by using the keyword search tool below to find specific information within the annual report.-
 1
1 -
2
-
3
-
4
-
5
-
6
-
7
-
8
-
9
-
10
-
11
-
12
-
13
-
14
-
15
-
16
-
17
-
18
-
19
-
20
-
21
-
22
-
23
-
24
-
25
-
26
-
27
-
28
-
29
-
30
-
31
-
32
-
33
-
34
-
35
-
36
-
37
-
38
-
39
-
40
-
41
-
42
-
43
-
44
-
45
-
46
-
47
-
48
-
49
-
50
-
51
-
52
-
53
-
54
-
55
-
56
-
57
-
58
-
59
-
60
-
61
-
62
-
63
-
64
-
65
-
66
-
67
-
68
-
69
-
70
-
71
-
72
-
73
-
74
-
75
-
76
-
77
-
78
-
79
-
80
-
81
-
82
-
83
-
84
-
85
-
86
-
87
-
88
-
89
-
90
-
91
-
92
-
93
-
94
-
95
-
96
-
97
-
98
-
99
-
100
-
101
-
102
-
103
-
104
-
105
-
106
-
107
-
108
-
109
-
110
-
111
-
112
-
113
-
114
-
115
-
116
-
117
-
118
-
119
-
120
-
121
-
122
-
123
-
124
-
125
-
126
-
127
-
128
-
129
-
130
-
131
-
132
-
133
-
134
-
135
-
136
-
137
-
138
-
139
-
140
-
141
-
142
-
143
-
144
-
145
-
146
-
147
-
148
-
149
-
150
-
151
-
152
-
153
-
154
-
155
-
156
-
157
-
158
-
159
-
160
-
161
-
162
-
163
-
164
-
165
-
166
-
167
-
168
-
169
-
170
-
171
-
172
-
173
-
174
-
175
-
176
-
177
-
178
-
179
-
180
-
181
-
182
-
183
-
184
-
185
-
186
-
187
-
188
-
189
-
190
-
191
-
192
-
193
-
194
-
195
-
196
-
197
-
198
-
199
-
200
-
201
-
202
-
203
-
204
-
205
-
206
-
207
-
208
-
209
-
210
-
211
-
212
-
 213
213 -
 214
214 -
 215
215 -
 216
216 -
 217
217 -
 218
218 -
 219
219 -
 220
220 -
 221
221 -
 222
222 -
 223
223 -
 224
224 -
 225
225 -
 226
226 -
 227
227 -
 228
228 -
 229
229 -
 230
230 -
 231
231 -
 232
232 -
 233
233 -
234
-
235
-
236
-
237
-
238
-
239
-
240
-
241
-
242
-
243
-
244
-
245
-
246
-
247
-
248
-
249
-
250
-
251
-
252
-
253
-
254
-
255
-
256
-
257
-
258
-
259
-
260
-
261
-
262
-
263
-
264
 |
 |

adidas Group
/
2013 Annual Report
Consolidated Financial Statements
219
2013
/
04.8
/
Notes
/
Notes to the Consolidated Statement of Financial Position
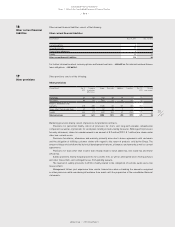
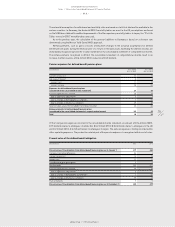
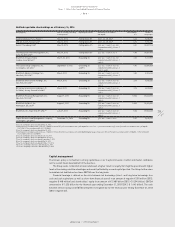
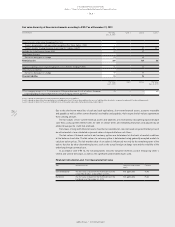
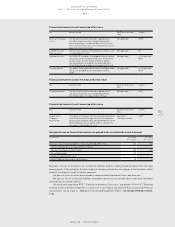
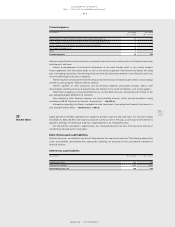
Notified reportable shareholdings as at February 14, 2014
Notifying party Date of reaching, exceeding
or falling below
Reporting threshold Attributions in accordance
with WpHG
Shareholdings
in %
Number of
voting rights
Société Générale, Paris, France 1) May 14, 2013 Falling below 5% §§ 21, 22, 25, 25a 2) 4.32 9,035,100
UBS AG, Zurich, Switzerland 3) May 14, 2013 Falling below 5% §§ 21, 22, 25, 25a 4) 4.73 9,906,287
Garrett Thornburg, USA 5) May 10, 2013 Falling below 5% § 22 sec. 1 sent. 1 no. 6 in
conjunction with § 22 sec. 1
sent. 2
4.81 10,057,706
Thornburg Investment Management, Inc.,
Santa Fe, NM, USA 5)
May 10, 2013 Falling below 5% § 22 sec. 1 sent. 1 no. 6 4.81 10,057,706
BlackRock Group Limited,
London, Great Britain 6)
March 20, 2013 Exceeding 3% § 22 sec. 1 sent. 1 no. 6 in
conjunction with § 22 sec. 1
sent. 2
3.02 6,317,959
The Capital Group Companies, Inc.,
Los Angeles, CA, USA 7)
September 1, 2012 Exceeding 3%
and 5%
§ 22 sec. 1 sent. 1 no. 6 in
conjunction with § 22 sec. 1
sent. 2 and 3
6.00 12,554,828
BlackRock Advisors Holdings, Inc.,
New York, NY, USA 8)
May 4, 2012 Exceeding 3% § 22 sec. 1 sent. 1 no. 6 in
conjunction with § 22 sec. 1
sent. 2
3.30 6,903,160
BlackRock International Holdings, Inc.,
New York, NY, USA 8)
May 4, 2012 Exceeding 3% § 22 sec. 1 sent. 1 no. 6 in
conjunction with § 22 sec. 1
sent. 2
3.16 6,605,250
BR Jersey International Holdings, L.P.,
St. Helier, Jersey, Channel Islands 8)
May 4, 2012 Exceeding 3% § 22 sec. 1 sent. 1 no. 6 in
conjunction with § 22 sec. 1
sent. 2
3.16 6,605,250
BlackRock Financial Management, Inc.,
New York, NY, USA 9)
August 9, 2011 Exceeding 5% § 22 sec. 1 sent. 1 no. 6 in
conjunction with § 22 sec. 1
sent. 2
5.004 10,468,681
BlackRock Holdco 2, Inc.,
Wilmington, DE, USA 9)
August 9, 2011 Exceeding 5% § 22 sec. 1 sent. 1 no. 6 in
conjunction with § 22 sec. 1
sent. 2
5.004 10,468,681
BlackRock, Inc., New York, NY, USA 10) July 27, 2011 Exceeding 5% § 22 sec. 1 sent. 1 no. 6 in
conjunction with § 22 sec. 1
sent. 2
5.04 10,549,445
Capital Research and Management Company,
Los Angeles, CA, USA 11)
December 19, 2008 Exceeding 5% § 22 sec. 1 sent. 1 no. 6 5.01 9,695,127
1) See the company’s disclosure dated May 23, 2013.
2) Notification in accordance with § 25a sec. 1 WpHG: 4.08% (8,527,141) in accordance with § 25a WpHG (thereof 1.74% = 3,642,900 held indirectly); 0.22% (463,822) in accordance with § 25 WpHG;
0.02% (44,137) in accordance with § 21, 22 WpHG.
3) See the company’s disclosure dated May 22, 2013.
4) Notification in accordance with § 25a sec. 1 WpHG: 0.98% (2,050,000) in accordance with § 25a WpHG (Equity Swaps, Futures); 2.38% (4,972,044) in accordance with § 25 WpHG; 1.38% (2,884,243)
in accordance with § 21, 22 WpHG.
5) See the company’s disclosure dated June 18, 2013.
6) See the company’s disclosure dated March 25, 2013.
7) See the company’s disclosure dated September 7, 2012.
8) See the company’s disclosure dated May 14, 2012.
9) See the company’s disclosure dated October 17, 2012.
10) See the company’s disclosure dated August 4, 2011.
11) See the company’s disclosure dated January 7, 2009.
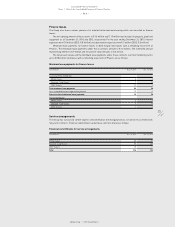
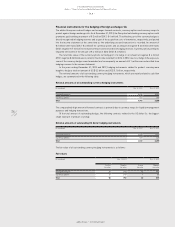
Capital management
The Group’s policy is to maintain a strong capital base so as to uphold investor, creditor and market confidence
and to sustain future development of the business.
The Group seeks to maintain a balance between a higher return on equity that might be possible with higher
levels of borrowings and the advantages and security afforded by a sound capital position. The Group further aims
to maintain net debt below two times EBITDA over the long term.
Financial leverage is defined as the ratio between net borrowings (short- and long-term borrowings less
cash and cash equivalents as well as short-term financial assets) in an amount of negative € 295 million (2012:
negative € 448 million) and shareholders’ equity in an amount of € 5.489 billion (2012: € 5.304 billion). EBITDA
amounted to € 1.523 billion for the financial year ending December 31, 2013 (2012: € 1.445 billion). The ratio
between net borrowings and EBITDA amounted to negative 0.2 for the financial year ending December 31, 2013
(2012: negative 0.3).