Reebok 2013 Annual Report Download - page 137
Download and view the complete annual report
Please find page 137 of the 2013 Reebok annual report below. You can navigate through the pages in the report by either clicking on the pages listed below, or by using the keyword search tool below to find specific information within the annual report.-
 1
1 -
2
-
3
-
4
-
5
-
6
-
7
-
8
-
9
-
10
-
11
-
12
-
13
-
14
-
15
-
16
-
17
-
18
-
19
-
20
-
21
-
22
-
23
-
24
-
25
-
26
-
27
-
28
-
29
-
30
-
31
-
32
-
33
-
34
-
35
-
36
-
37
-
38
-
39
-
40
-
41
-
42
-
43
-
44
-
45
-
46
-
47
-
48
-
49
-
50
-
51
-
52
-
53
-
54
-
55
-
56
-
57
-
58
-
59
-
60
-
61
-
62
-
63
-
64
-
65
-
66
-
67
-
68
-
69
-
70
-
71
-
72
-
73
-
74
-
75
-
76
-
77
-
78
-
79
-
80
-
81
-
82
-
83
-
84
-
85
-
86
-
87
-
88
-
89
-
90
-
91
-
92
-
93
-
94
-
95
-
96
-
97
-
98
-
99
-
100
-
101
-
102
-
103
-
104
-
105
-
106
-
107
-
108
-
109
-
110
-
111
-
112
-
113
-
114
-
115
-
116
-
117
-
118
-
119
-
120
-
121
-
122
-
123
-
124
-
125
-
126
-
 127
127 -
 128
128 -
 129
129 -
 130
130 -
 131
131 -
 132
132 -
 133
133 -
 134
134 -
 135
135 -
 136
136 -
 137
137 -
 138
138 -
 139
139 -
 140
140 -
 141
141 -
 142
142 -
 143
143 -
 144
144 -
 145
145 -
 146
146 -
 147
147 -
148
-
149
-
150
-
151
-
152
-
153
-
154
-
155
-
156
-
157
-
158
-
159
-
160
-
161
-
162
-
163
-
164
-
165
-
166
-
167
-
168
-
169
-
170
-
171
-
172
-
173
-
174
-
175
-
176
-
177
-
178
-
179
-
180
-
181
-
182
-
183
-
184
-
185
-
186
-
187
-
188
-
189
-
190
-
191
-
192
-
193
-
194
-
195
-
196
-
197
-
198
-
199
-
200
-
201
-
202
-
203
-
204
-
205
-
206
-
207
-
208
-
209
-
210
-
211
-
212
-
213
-
214
-
215
-
216
-
217
-
218
-
219
-
220
-
221
-
222
-
223
-
224
-
225
-
226
-
227
-
228
-
229
-
230
-
231
-
232
-
233
-
234
-
235
-
236
-
237
-
238
-
239
-
240
-
241
-
242
-
243
-
244
-
245
-
246
-
247
-
248
-
249
-
250
-
251
-
252
-
253
-
254
-
255
-
256
-
257
-
258
-
259
-
260
-
261
-
262
-
263
-
264
 |
 |

adidas Group
/
2013 Annual Report
Group Management Report – Financial Review
133
2013
/
03.2
/
Group Business Performance
/
Statement of Financial Position and Statement of Cash Flows
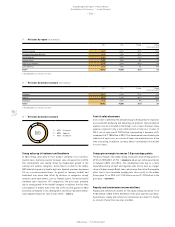
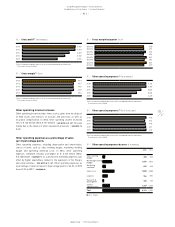
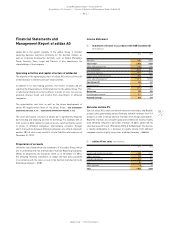
Operating working capital
Operating working capital increased 10% to € 2.618 billion at the end of
December 2013 compared to € 2.384 billion in 2012
/
DIAGRAM 40. This
was due to the increase in inventories related to the Group’s expectations
for growth in the coming quarters as well as higher inventories in
Russia/CIS following distribution centre issues during the second
half of 2013. Higher receivables reflecting the growth of our business
during the fourth quarter of 2013 also contributed to the increase in
operating working capital. As a result, average operating working
capital as a percentage of sales increased 0.9 percentage points to
20.9% (2012: 20.0%), above our initial guidance of a moderate increase
/
DIAGRAM 41.
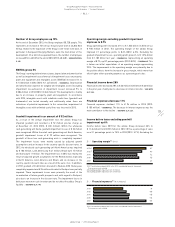
Liabilities and equity
Total current liabilities increased 8% to € 4.732 billion at the end of
December 2013 from € 4.374 billion at the end of December 2012.
Accounts payable were up 2% to € 1.825 billion at the end of December
2013 versus € 1.790 billion at the end of 2012
/
DIAGRAM 38. On a currency-
neutral basis, accounts payable increased 5%, which is in line with the
increase in inventories. At the end of December 2013, other current
financial liabilities increased 37% to € 113 million from € 83 million
in 2012, primarily as a result of the increase in the negative fair value
of financial instruments
/
SEE NOTE 18, P. 211. Short-term borrowings
more than doubled to € 681 million at the end of December 2013
(2012: € 280 million). The increase was mainly due to a reclassification
of long-term borrowings to short-term borrowings, as a result of the
Group’s Eurobond, which will mature in July 2014. Other current
provisions were down 20% to € 450 million at the end of 2013 versus
€ 563 million at the end of 2012. This primarily relates to a decrease in
provisions for returns and allowances, provisions for personnel as well
as other operational provisions. In addition, currency effects contributed
to the decline in other current provisions
/
SEE NOTE 19, P. 211. Current
accrued liabilities increased 6% to € 1.147 billion at the end of 2013
from € 1.084 billion in 2012, mainly due to an increase in accruals for
customer discounts as well as for outstanding invoices
/
SEE NOTE 20,
P. 212. Other current liabilities were down 8% to € 276 million at the
end of 2013 from € 299 million in 2012, mainly due to a decrease in tax
liabilities other than income taxes
/
SEE NOTE 21, P. 212.
Total non-current liabilities decreased 30% to € 1.386 billion at the end
of December 2013 from € 1.986 billion in the prior year. Long-term
borrowings declined 46% to € 653 million at the end of December 2013
from € 1.207 billion in the prior year. This development was mainly due
to a reclassification of long-term borrowings to short-term borrowings,
as a result of the Group’s Eurobond, which will mature in July 2014
/
SEE
NOTE 17, P. 209.
Shareholders’ equity increased 3% to € 5.489 billion at the end of
December 2013 versus € 5.304 billion in 2012
/
DIAGRAM 39. The
net income generated during the last twelve months was the main
contributor to this development, partially offset by negative currency
translation effects of € 312 million, the dividend paid to shareholders of
€ 282 million for the 2012 financial year as well as a decrease in hedging
reserves of € 13 million
/
SEE NOTE 25, P. 217. The Group’s equity ratio at
the end of December 2013 improved to 47.3% compared to 45.5% in the
prior year.
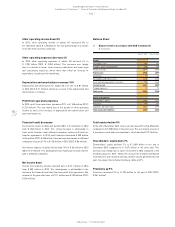
39
/
Shareholders’ equity 1) (€ in millions)
2013 5,489
2012 5,304
2011 5,137
2010 4,616
2009 3,771
1) 2011 restated according to IAS 8 in the 2012 consolidated financial statements.
Prior years are not restated.
41
/
Average operating working capital 1) (in % of net sales)
2013 20.9
2012 20.0
2011 20.4
2010 20.8
2009 24.3
1) 2011 restated according to IAS 8 in the 2012 consolidated financial statements.
Prior years are not restated.
40
/
Operating working capital (€ in millions)
Q4 2013 2,618
Q4 2012 2,384
Q3 2013 3,273
Q3 2012 3,337
Q2 2013 2,895
Q2 2012 2,966
Q1 2013 3,324
Q1 2012 3,201