Reebok 2013 Annual Report Download - page 205
Download and view the complete annual report
Please find page 205 of the 2013 Reebok annual report below. You can navigate through the pages in the report by either clicking on the pages listed below, or by using the keyword search tool below to find specific information within the annual report.-
 1
1 -
2
-
3
-
4
-
5
-
6
-
7
-
8
-
9
-
10
-
11
-
12
-
13
-
14
-
15
-
16
-
17
-
18
-
19
-
20
-
21
-
22
-
23
-
24
-
25
-
26
-
27
-
28
-
29
-
30
-
31
-
32
-
33
-
34
-
35
-
36
-
37
-
38
-
39
-
40
-
41
-
42
-
43
-
44
-
45
-
46
-
47
-
48
-
49
-
50
-
51
-
52
-
53
-
54
-
55
-
56
-
57
-
58
-
59
-
60
-
61
-
62
-
63
-
64
-
65
-
66
-
67
-
68
-
69
-
70
-
71
-
72
-
73
-
74
-
75
-
76
-
77
-
78
-
79
-
80
-
81
-
82
-
83
-
84
-
85
-
86
-
87
-
88
-
89
-
90
-
91
-
92
-
93
-
94
-
95
-
96
-
97
-
98
-
99
-
100
-
101
-
102
-
103
-
104
-
105
-
106
-
107
-
108
-
109
-
110
-
111
-
112
-
113
-
114
-
115
-
116
-
117
-
118
-
119
-
120
-
121
-
122
-
123
-
124
-
125
-
126
-
127
-
128
-
129
-
130
-
131
-
132
-
133
-
134
-
135
-
136
-
137
-
138
-
139
-
140
-
141
-
142
-
143
-
144
-
145
-
146
-
147
-
148
-
149
-
150
-
151
-
152
-
153
-
154
-
155
-
156
-
157
-
158
-
159
-
160
-
161
-
162
-
163
-
164
-
165
-
166
-
167
-
168
-
169
-
170
-
171
-
172
-
173
-
174
-
175
-
176
-
177
-
178
-
179
-
180
-
181
-
182
-
183
-
184
-
185
-
186
-
187
-
188
-
189
-
190
-
191
-
192
-
193
-
194
-
 195
195 -
 196
196 -
 197
197 -
 198
198 -
 199
199 -
 200
200 -
 201
201 -
 202
202 -
 203
203 -
 204
204 -
 205
205 -
 206
206 -
 207
207 -
 208
208 -
 209
209 -
 210
210 -
 211
211 -
 212
212 -
 213
213 -
 214
214 -
 215
215 -
216
-
217
-
218
-
219
-
220
-
221
-
222
-
223
-
224
-
225
-
226
-
227
-
228
-
229
-
230
-
231
-
232
-
233
-
234
-
235
-
236
-
237
-
238
-
239
-
240
-
241
-
242
-
243
-
244
-
245
-
246
-
247
-
248
-
249
-
250
-
251
-
252
-
253
-
254
-
255
-
256
-
257
-
258
-
259
-
260
-
261
-
262
-
263
-
264
 |
 |

adidas Group
/
2013 Annual Report
Consolidated Financial Statements
201
2013
Notes
/
04.8
/
Discount rates are based on a weighted average cost of capital calculation considering a five-year average
market-weighted debt/equity structure and financing costs referencing the Group’s major competitors for each
cash-generating unit (or groups of units). The discount rates used are after-tax rates and reflect the specific
equity and country risk of the relevant cash-generating unit.
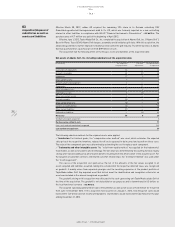
In total, goodwill impairment losses of € 52 million have been recognised in 2013 (2012: € 265 million). Within
the Wholesale segment, goodwill impairment losses amounted to € 23 million in Iberia, and within the Retail
segment goodwill impairment losses amounted to € 29 million in North America. The goodwill of the respective
cash-generating units is completely impaired. The impairment losses were mainly caused by adjusted growth
assumptions and an increase in the country-specific discount rates. In 2012, within the Wholesale segment,
goodwill impairment losses amounted to € 106 million in North America, € 41 million in Latin America, € 15 million
in Brazil and € 11 million in Iberia. Additionally, in 2012, goodwill of € 68 million allocated to Reebok-CCM Hockey
was completely impaired and € 24 million allocated to Rockport was partially impaired.
A change in the discount rate by approximately 1.5% or a reduction of planned free cash inflows by
approximately 20% would result in complete impairment requirement for the cash-generating units Retail Japan
(goodwill € 8 million), Retail South Europe (goodwill € 7 million) and Retail Brazil (goodwill € 2 million) as well
as Rockport (goodwill € 28 million). For all other cash-generating units, even an increase in the discount rate
by approximately 4% or a reduction of planned free cash inflows by approximately 30% would not result in any
additional impairment requirement.
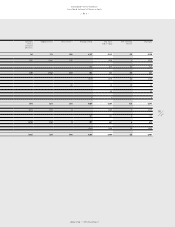
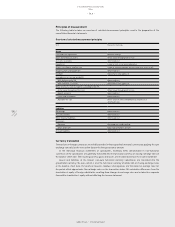
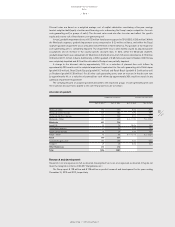
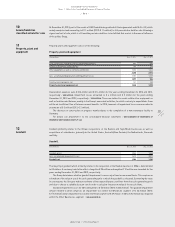
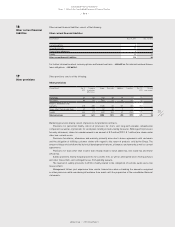
The carrying amounts of acquired goodwill allocated to the respective groups of cash-generating units and
the respective discount rates applied to the cash flow projections are as follows:
Allocation of goodwill
Goodwill (€ in millions) Discount rate (after taxes)
Dec. 31, 2013 Dec. 31, 2012 Dec. 31, 2013 Dec. 31, 2012
Wholesale China 156 160 8.6% 8.1%
Wholesale Central Europe 149 154 7.9% 7.5%
Wholesale Northern Europe 129 133 8.0% 7.4%
Wholesale – Other 257 287 8.0 – 11.3% 7.2 – 11.3%
Wholesale 691 734
Retail CIS 76 78 10.4% 9.6%
Retail North America — 29 7.7% 7.2%
Retail Central Europe 28 29 7.9% 7.5%
Retail – Other 93 95 8.0 – 12.1% 7.2 – 11.3%
Retail 197 231
TaylorMade-adidas Golf 288 288 8.0% 7.6%
Rockport 28 28 8.4% 8.0%
Other Businesses 316 316
Total 1,204 1,281
Research and development
Research costs are expensed in full as incurred. Development costs are also expensed as incurred if they do not
meet the recognition criteria of IAS 38 “Intangible Assets”.
The Group spent € 128 million and € 128 million on product research and development for the years ending
December 31, 2013 and 2012, respectively.