Reebok 2013 Annual Report Download - page 136
Download and view the complete annual report
Please find page 136 of the 2013 Reebok annual report below. You can navigate through the pages in the report by either clicking on the pages listed below, or by using the keyword search tool below to find specific information within the annual report.-
 1
1 -
2
-
3
-
4
-
5
-
6
-
7
-
8
-
9
-
10
-
11
-
12
-
13
-
14
-
15
-
16
-
17
-
18
-
19
-
20
-
21
-
22
-
23
-
24
-
25
-
26
-
27
-
28
-
29
-
30
-
31
-
32
-
33
-
34
-
35
-
36
-
37
-
38
-
39
-
40
-
41
-
42
-
43
-
44
-
45
-
46
-
47
-
48
-
49
-
50
-
51
-
52
-
53
-
54
-
55
-
56
-
57
-
58
-
59
-
60
-
61
-
62
-
63
-
64
-
65
-
66
-
67
-
68
-
69
-
70
-
71
-
72
-
73
-
74
-
75
-
76
-
77
-
78
-
79
-
80
-
81
-
82
-
83
-
84
-
85
-
86
-
87
-
88
-
89
-
90
-
91
-
92
-
93
-
94
-
95
-
96
-
97
-
98
-
99
-
100
-
101
-
102
-
103
-
104
-
105
-
106
-
107
-
108
-
109
-
110
-
111
-
112
-
113
-
114
-
115
-
116
-
117
-
118
-
119
-
120
-
121
-
122
-
123
-
124
-
125
-
 126
126 -
 127
127 -
 128
128 -
 129
129 -
 130
130 -
 131
131 -
 132
132 -
 133
133 -
 134
134 -
 135
135 -
 136
136 -
 137
137 -
 138
138 -
 139
139 -
 140
140 -
 141
141 -
 142
142 -
 143
143 -
 144
144 -
 145
145 -
 146
146 -
147
-
148
-
149
-
150
-
151
-
152
-
153
-
154
-
155
-
156
-
157
-
158
-
159
-
160
-
161
-
162
-
163
-
164
-
165
-
166
-
167
-
168
-
169
-
170
-
171
-
172
-
173
-
174
-
175
-
176
-
177
-
178
-
179
-
180
-
181
-
182
-
183
-
184
-
185
-
186
-
187
-
188
-
189
-
190
-
191
-
192
-
193
-
194
-
195
-
196
-
197
-
198
-
199
-
200
-
201
-
202
-
203
-
204
-
205
-
206
-
207
-
208
-
209
-
210
-
211
-
212
-
213
-
214
-
215
-
216
-
217
-
218
-
219
-
220
-
221
-
222
-
223
-
224
-
225
-
226
-
227
-
228
-
229
-
230
-
231
-
232
-
233
-
234
-
235
-
236
-
237
-
238
-
239
-
240
-
241
-
242
-
243
-
244
-
245
-
246
-
247
-
248
-
249
-
250
-
251
-
252
-
253
-
254
-
255
-
256
-
257
-
258
-
259
-
260
-
261
-
262
-
263
-
264
 |
 |

adidas Group
/
2013 Annual Report
Group Management Report – Financial Review
132
2013
/
03.2
/
Group Business Performance
/
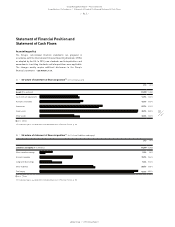
Statement of Financial Position and Statement of Cash Flows
35
/
Total assets 1) (€ in millions)
2013 11,599
2012 11,651
2011 11,237
2010 10,618
2009 8,875
1) 2011 restated according to IAS 8 in the 2012 consolidated financial statements.
Prior years are not restated.
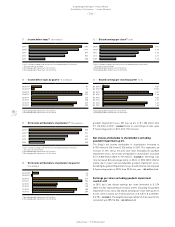
36
/
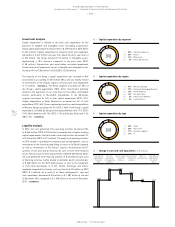
Inventories 1) (€ in millions)
2013 2,634
2012 2,486
2011 2,502
2010 2,119
2009 1,471
1) 2011 restated according to IAS 8 in the 2012 consolidated financial statements.
Prior years are not restated.
37
/
Accounts receivable 1) (€ in millions)
2013 1,809
2012 1,688
2011 1,595
2010 1,667
2009 1,429
1) 2011 restated according to IAS 8 in the 2012 consolidated financial statements.
Prior years are not restated.
38
/
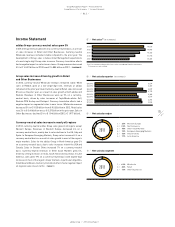
Accounts payable 1) (€ in millions)
2013 1,825
2012 1,790
2011 1,887
2010 1,694
2009 1,166
1) 2011 restated according to IAS 8 in the 2012 consolidated financial statements.
Prior years are not restated.
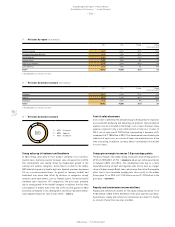
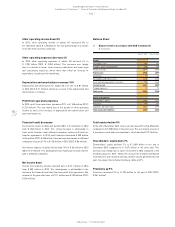
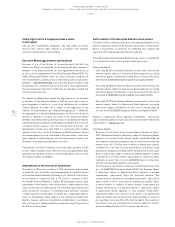
Assets
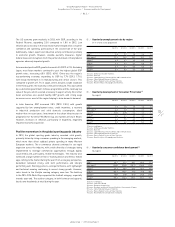
At the end of December 2013, total assets remained virtually unchanged
at € 11.599 billion versus € 11.651 billion in the prior year
/
DIAGRAM 35.
The share of current assets and non-current assets within total assets
remained unchanged at 59% and 41% at the end of December 2013
(2012: 59% and 41%).
Total current assets remained virtually unchanged at € 6.857 billion
at the end of December 2013 compared to € 6.877 billion in 2012.
Cash and cash equivalents decreased 5% to € 1.587 billion at the end
of December 2013 from € 1.670 billion in the prior year, as net cash
generated from operating activities was more than offset by net cash
used in investing and financing activities. Negative currency effects
also contributed to this development. Group inventories increased 6%
to € 2.634 billion at the end of December 2013 versus € 2.486 billion in
2012
/
SEE NOTE 08, P. 206. On a currency-neutral basis, inventories were
up 13% as a result of the Group’s expectations for growth in the coming
quarters as well as higher inventories in Russia/CIS due to distribution
centre issues during the second half of 2013
/
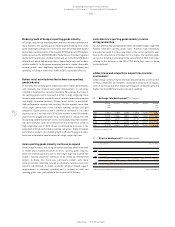
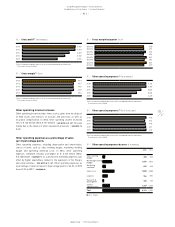
DIAGRAM 36. Short-term
financial assets declined 84% to € 41 million at the end of December
2013 from € 265 million in 2012
/
SEE NOTE 05, P. 205. This development
was driven by the decrease in short-term cash investments. Group
receivables increased 7% to € 1.809 billion at the end of December
2013 (2012: € 1.688 billion)
/
SEE NOTE 06, P. 205. On a currency-neutral
basis, receivables were up 17%, reflecting the growth of our business
during the fourth quarter of 2013
/
DIAGRAM 37. Other current financial
assets declined 5% to € 183 million at the end of December 2013 from
€ 192 million in 2012
/
SEE NOTE 07, P. 206. This development was driven
by a decrease in security deposits as well as a decrease in the fair
value of financial instruments. Other current assets increased 4% to
€ 506 million at the end of December 2013 from € 489 million in 2012,
mainly due to the increase in prepayments
/
SEE NOTE 09, P. 206.
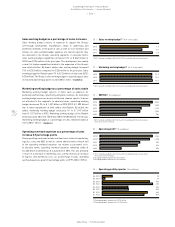
Total non-current assets decreased 1% to € 4.742 billion at the
end of December 2013 from € 4.774 billion in 2012. Fixed assets
remained stable at € 4.144 billion at the end of December 2013 versus
€ 4.139 billion in 2012. Fixed assets include property, plant and
equipment, goodwill, trademarks and other intangible assets as well as
long-term financial assets. Additions in an amount of € 492 million were
primarily related to the continued expansion of our own-retail activities,
the construction of the European Distribution Centre near Osnabrueck,
Germany, investments into the Group’s IT infrastructure as well as the
further development of the Group’s headquarters in Herzogenaurach.
Additions were offset by depreciation and amortisation of € 291 million,
negative currency effects of € 132 million, the goodwill impairment of
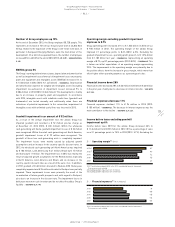
€ 52 million and disposals of € 12 million. The majority of goodwill is
primarily related to the acquisition of the Reebok business in 2006. At
the end of December 2013, goodwill decreased 6% to € 1.204 billion
from € 1.281 billion in the prior year. The decrease is mainly related to
goodwill impaired of € 52 million, of which € 23 million is related to the
Wholesale segment and € 29 million is related to Retail segment
/
SEE
NOTE 02, P. 195
/
SEE NOTE 12, P. 207. Other non-current financial
assets grew 41% to € 30 million at the end of December 2013 from
€ 21 million in 2012, driven by an increase in the fair value of financial
instruments
/
SEE NOTE 15, P. 209.