Reebok 2013 Annual Report Download - page 152
Download and view the complete annual report
Please find page 152 of the 2013 Reebok annual report below. You can navigate through the pages in the report by either clicking on the pages listed below, or by using the keyword search tool below to find specific information within the annual report.-
 1
1 -
2
-
3
-
4
-
5
-
6
-
7
-
8
-
9
-
10
-
11
-
12
-
13
-
14
-
15
-
16
-
17
-
18
-
19
-
20
-
21
-
22
-
23
-
24
-
25
-
26
-
27
-
28
-
29
-
30
-
31
-
32
-
33
-
34
-
35
-
36
-
37
-
38
-
39
-
40
-
41
-
42
-
43
-
44
-
45
-
46
-
47
-
48
-
49
-
50
-
51
-
52
-
53
-
54
-
55
-
56
-
57
-
58
-
59
-
60
-
61
-
62
-
63
-
64
-
65
-
66
-
67
-
68
-
69
-
70
-
71
-
72
-
73
-
74
-
75
-
76
-
77
-
78
-
79
-
80
-
81
-
82
-
83
-
84
-
85
-
86
-
87
-
88
-
89
-
90
-
91
-
92
-
93
-
94
-
95
-
96
-
97
-
98
-
99
-
100
-
101
-
102
-
103
-
104
-
105
-
106
-
107
-
108
-
109
-
110
-
111
-
112
-
113
-
114
-
115
-
116
-
117
-
118
-
119
-
120
-
121
-
122
-
123
-
124
-
125
-
126
-
127
-
128
-
129
-
130
-
131
-
132
-
133
-
134
-
135
-
136
-
137
-
138
-
139
-
140
-
141
-
 142
142 -
 143
143 -
 144
144 -
 145
145 -
 146
146 -
 147
147 -
 148
148 -
 149
149 -
 150
150 -
 151
151 -
 152
152 -
 153
153 -
 154
154 -
 155
155 -
 156
156 -
 157
157 -
 158
158 -
 159
159 -
 160
160 -
 161
161 -
 162
162 -
163
-
164
-
165
-
166
-
167
-
168
-
169
-
170
-
171
-
172
-
173
-
174
-
175
-
176
-
177
-
178
-
179
-
180
-
181
-
182
-
183
-
184
-
185
-
186
-
187
-
188
-
189
-
190
-
191
-
192
-
193
-
194
-
195
-
196
-
197
-
198
-
199
-
200
-
201
-
202
-
203
-
204
-
205
-
206
-
207
-
208
-
209
-
210
-
211
-
212
-
213
-
214
-
215
-
216
-
217
-
218
-
219
-
220
-
221
-
222
-
223
-
224
-
225
-
226
-
227
-
228
-
229
-
230
-
231
-
232
-
233
-
234
-
235
-
236
-
237
-
238
-
239
-
240
-
241
-
242
-
243
-
244
-
245
-
246
-
247
-
248
-
249
-
250
-
251
-
252
-
253
-
254
-
255
-
256
-
257
-
258
-
259
-
260
-
261
-
262
-
263
-
264
 |
 |

adidas Group
/
2013 Annual Report
Group Management Report – Financial Review
148
2013
/
03.3
/
Business Performance by Segment
/
Other Businesses Performance
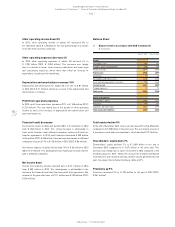
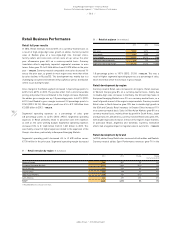
Factory outlet revenues include sales from adidas and Reebok factory
outlets. In 2013, factory outlet revenues grew 4% on a currency-neutral
basis. Sales increased at a mid-single-digit rate at adidas, while Reebok
sales declined at a low-single-digit rate. Comparable factory outlet sales
remained stable on a currency-neutral basis. In 2013, the Group opened
101 and closed 52 factory outlets. As a result, the number of factory
outlets increased by 49 to 779 at the end of 2013 (December 31, 2012:
730)
/
TABLE 16. Currency translation effects had a negative impact on
sales in euro terms. Factory outlet sales decreased 1% to € 1.507 billion
from € 1.528 billion in 2012.
Concession corner revenues include adidas and Reebok concession
corners. In 2013, sales from concession corners increased 6% on a
currency-neutral basis. Sales grew at a double-digit rate at Reebok,
and adidas sales were up at a mid-single-digit rate. Currency-neutral
comparable sales from concession corners grew 6%. In 2013, the
Group opened 84 concession corners and closed 63. As a result, the
number of concession corners increased by 21 to 300 at the end of 2013
(December 31, 2012: 279), of which 200 were related to the adidas brand
and 100 to the Reebok brand
/
TABLE 16. Currency translation effects
had a negative impact on sales in euro terms. Concession corner sales
increased 3% to € 115 million (2012: € 112 million).
eCommerce revenues include e-commerce operations of the adidas and
Reebok brands. In 2013, sales from adidas and Reebok e-commerce
platforms were up 64% on a currency-neutral basis compared to
2012. Sales increased at strong double-digit rates at both adidas and
Reebok. Currency translation effects had a negative impact on sales
in euro terms. eCommerce revenues grew 58% to € 250 million from
€ 158 million in 2012.
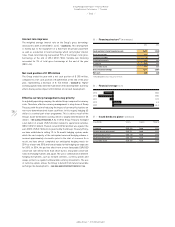
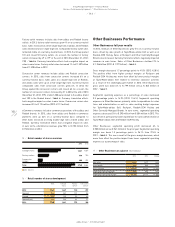
Other Businesses Performance
Other Businesses full year results
In 2013, revenues of Other Businesses grew 5% on a currency-neutral
basis, driven by sales growth at TaylorMade-adidas Golf as well as at
Reebok-CCM Hockey. Sales at Rockport and Other Centrally Managed
Brands also increased. Currency translation effects negatively impacted
revenues in euro terms. Sales of Other Businesses declined 2% to
€ 1.946 billion (2012: € 1.977 billion)
/
TABLE 17.
Gross margin decreased 1.7 percentage points to 41.0% (2012: 42.8%).
The positive effect from higher product margins at Rockport and
Reebok-CCM Hockey was more than offset by lower product margins
at TaylorMade-adidas Golf related to inventory clearance activities
as a result of the challenging golf market in 2013. Other Businesses
gross profit was down 6% to € 799 million versus € 845 million in
2012
/
TABLE 17.
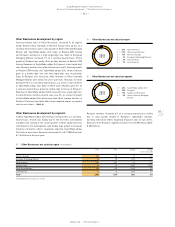
Segmental operating expenses as a percentage of sales decreased
0.5 percentage points to 14.9% (2012: 15.4%). Segmental operating
expenses in Other Businesses primarily relate to expenditure for sales
force and administration as well as sales working budget expenses
for TaylorMade-adidas Golf, Rockport, Reebok-CCM Hockey and
Other Centrally Managed Brands. In euro terms, segmental operating
expenses decreased 5% to € 290 million from € 304 million in 2012. This
was driven in particular by lower expenditure for sales administration at
TaylorMade-adidas Golf and Reebok-CCM Hockey.
Other Businesses segmental operating profit decreased 6% to
€ 508 million versus € 541 million in the prior year. Segmental operating
margin was down 1.3 percentage points to 26.1% from 27.4% in
2012
/
TABLE 17. This was a result of the gross margin decrease, which
more than offset the positive impact from lower segmental operating
expenses as a percentage of sales.
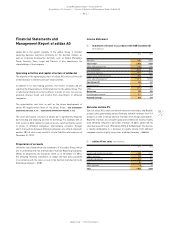
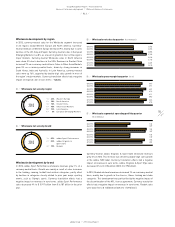
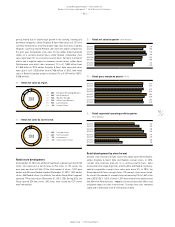
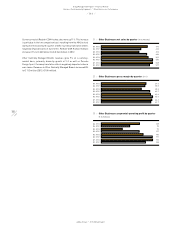
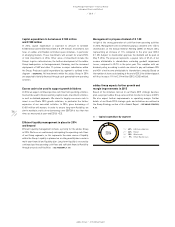
15
/
Retail number of stores overview
2013 2012
Concept stores 1,661 1,437
Factory outlets 779 730
Concession
corners 300 279
Total 2,740 2,446
■ 2013 ■ 2012
17
/
Other Businesses at a glance (€ in millions)
2013 2012 Change
Net sales 1,946 1,977 (2%)
Gross profit 799 845 (6%)
Gross margin 41.0% 42.8% (1.7pp)
Segmental operating profit 508 541 (6%)
Segmental operating margin 26.1% 27.4% (1.3pp)
16
/
Retail number of stores development
Total Concept
stores
Factory
outlets
Concession
corners
2012 2,446 1,437 730 279
Opened 534 349 101 84
Closed 240 125 52 63
Opened (net) 294 224 49 21
2013 2,740 1,661 779 300