Reebok 2013 Annual Report Download - page 4
Download and view the complete annual report
Please find page 4 of the 2013 Reebok annual report below. You can navigate through the pages in the report by either clicking on the pages listed below, or by using the keyword search tool below to find specific information within the annual report.-
 1
1 -
 2
2 -
 3
3 -
 4
4 -
 5
5 -
 6
6 -
 7
7 -
 8
8 -
 9
9 -
 10
10 -
 11
11 -
 12
12 -
 13
13 -
 14
14 -
 15
15 -
16
-
17
-
18
-
19
-
20
-
21
-
22
-
23
-
24
-
25
-
26
-
27
-
28
-
29
-
30
-
31
-
32
-
33
-
34
-
35
-
36
-
37
-
38
-
39
-
40
-
41
-
42
-
43
-
44
-
45
-
46
-
47
-
48
-
49
-
50
-
51
-
52
-
53
-
54
-
55
-
56
-
57
-
58
-
59
-
60
-
61
-
62
-
63
-
64
-
65
-
66
-
67
-
68
-
69
-
70
-
71
-
72
-
73
-
74
-
75
-
76
-
77
-
78
-
79
-
80
-
81
-
82
-
83
-
84
-
85
-
86
-
87
-
88
-
89
-
90
-
91
-
92
-
93
-
94
-
95
-
96
-
97
-
98
-
99
-
100
-
101
-
102
-
103
-
104
-
105
-
106
-
107
-
108
-
109
-
110
-
111
-
112
-
113
-
114
-
115
-
116
-
117
-
118
-
119
-
120
-
121
-
122
-
123
-
124
-
125
-
126
-
127
-
128
-
129
-
130
-
131
-
132
-
133
-
134
-
135
-
136
-
137
-
138
-
139
-
140
-
141
-
142
-
143
-
144
-
145
-
146
-
147
-
148
-
149
-
150
-
151
-
152
-
153
-
154
-
155
-
156
-
157
-
158
-
159
-
160
-
161
-
162
-
163
-
164
-
165
-
166
-
167
-
168
-
169
-
170
-
171
-
172
-
173
-
174
-
175
-
176
-
177
-
178
-
179
-
180
-
181
-
182
-
183
-
184
-
185
-
186
-
187
-
188
-
189
-
190
-
191
-
192
-
193
-
194
-
195
-
196
-
197
-
198
-
199
-
200
-
201
-
202
-
203
-
204
-
205
-
206
-
207
-
208
-
209
-
210
-
211
-
212
-
213
-
214
-
215
-
216
-
217
-
218
-
219
-
220
-
221
-
222
-
223
-
224
-
225
-
226
-
227
-
228
-
229
-
230
-
231
-
232
-
233
-
234
-
235
-
236
-
237
-
238
-
239
-
240
-
241
-
242
-
243
-
244
-
245
-
246
-
247
-
248
-
249
-
250
-
251
-
252
-
253
-
254
-
255
-
256
-
257
-
258
-
259
-
260
-
261
-
262
-
263
-
264
 |
 |
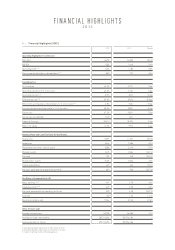
FINANCIAL HIGHLIGHTS
2013
1) Excluding goodwill impairment of € 52 million in 2013.
2) Excluding goodwill impairment of € 265 million in 2012.
3) Subject to Annual General Meeting approval.
01 / Financial Highlights (IFRS)
2013 2012 Change
Operating Highlights (€ in millions)
Net sales 14,492 14,883 (2.6%)
EBITDA 1,523 1,445 5.4%
Operating profit 1) 2) 1,254 1,185 5.8%
Net income attributable to shareholders 1) 2) 839 791 6.0%
Key Ratios (%)
Gross margin 49.3% 47.7% 1.5pp
Operating expenses in % of net sales 42.3% 41.3% 1.0pp
Operating margin 1) 2) 8.7% 8.0% 0.7pp
Effective tax rate 1) 2) 29.0% 29.3% (0.3pp)
Net income attributable to shareholders in % of net sales 1) 2) 5.8% 5.3% 0.5pp
Average operating working capital in % of net sales 20.9% 20.0% 0.9pp
Equity ratio 47.3% 45.5% 1.8pp
Net borrowings/EBITDA (0.2) (0.3)
Financial leverage (5.4%) (8.5%) 3.1pp
Return on equity 14.3% 9.9% 4.4pp
Balance Sheet and Cash Flow Data (€ in millions)
Total assets 11,599 11,651 (0.4%)
Inventories 2,634 2,486 5.9%
Receivables and other current assets 2,583 2,444 5.7%
Working capital 2,125 2,504 (15.1%)
Net cash 295 448 (34.3%)
Shareholders’ equity 5,489 5,304 3.5%
Capital expenditure 479 434 10.4%
Net cash generated from operating activities 634 942 (32.7%)
Per Share of Common Stock (€)
Basic earnings 1) 2) 4.01 3.78 6.0%
Diluted earnings 1) 2) 4.01 3.78 6.0%
Net cash generated from operating activities 3.03 4.50 (32.7%)
Dividend 1.50 3) 1.35 11.1%
Share price at year-end 92.64 67.33 37.6%
Other (at year-end)
Number of employees 50,728 46,306 9.5%
Number of shares outstanding 209,216,186 209,216,186 —
Average number of shares 209,216,186 209,216,186 —