Reebok 2013 Annual Report Download - page 142
Download and view the complete annual report
Please find page 142 of the 2013 Reebok annual report below. You can navigate through the pages in the report by either clicking on the pages listed below, or by using the keyword search tool below to find specific information within the annual report.-
 1
1 -
2
-
3
-
4
-
5
-
6
-
7
-
8
-
9
-
10
-
11
-
12
-
13
-
14
-
15
-
16
-
17
-
18
-
19
-
20
-
21
-
22
-
23
-
24
-
25
-
26
-
27
-
28
-
29
-
30
-
31
-
32
-
33
-
34
-
35
-
36
-
37
-
38
-
39
-
40
-
41
-
42
-
43
-
44
-
45
-
46
-
47
-
48
-
49
-
50
-
51
-
52
-
53
-
54
-
55
-
56
-
57
-
58
-
59
-
60
-
61
-
62
-
63
-
64
-
65
-
66
-
67
-
68
-
69
-
70
-
71
-
72
-
73
-
74
-
75
-
76
-
77
-
78
-
79
-
80
-
81
-
82
-
83
-
84
-
85
-
86
-
87
-
88
-
89
-
90
-
91
-
92
-
93
-
94
-
95
-
96
-
97
-
98
-
99
-
100
-
101
-
102
-
103
-
104
-
105
-
106
-
107
-
108
-
109
-
110
-
111
-
112
-
113
-
114
-
115
-
116
-
117
-
118
-
119
-
120
-
121
-
122
-
123
-
124
-
125
-
126
-
127
-
128
-
129
-
130
-
131
-
 132
132 -
 133
133 -
 134
134 -
 135
135 -
 136
136 -
 137
137 -
 138
138 -
 139
139 -
 140
140 -
 141
141 -
 142
142 -
 143
143 -
 144
144 -
 145
145 -
 146
146 -
 147
147 -
 148
148 -
 149
149 -
 150
150 -
 151
151 -
 152
152 -
153
-
154
-
155
-
156
-
157
-
158
-
159
-
160
-
161
-
162
-
163
-
164
-
165
-
166
-
167
-
168
-
169
-
170
-
171
-
172
-
173
-
174
-
175
-
176
-
177
-
178
-
179
-
180
-
181
-
182
-
183
-
184
-
185
-
186
-
187
-
188
-
189
-
190
-
191
-
192
-
193
-
194
-
195
-
196
-
197
-
198
-
199
-
200
-
201
-
202
-
203
-
204
-
205
-
206
-
207
-
208
-
209
-
210
-
211
-
212
-
213
-
214
-
215
-
216
-
217
-
218
-
219
-
220
-
221
-
222
-
223
-
224
-
225
-
226
-
227
-
228
-
229
-
230
-
231
-
232
-
233
-
234
-
235
-
236
-
237
-
238
-
239
-
240
-
241
-
242
-
243
-
244
-
245
-
246
-
247
-
248
-
249
-
250
-
251
-
252
-
253
-
254
-
255
-
256
-
257
-
258
-
259
-
260
-
261
-
262
-
263
-
264
 |
 |
adidas Group
/
2013 Annual Report
Group Management Report – Financial Review
138
2013
/
03.2
/
Group Business Performance
/
Treasury
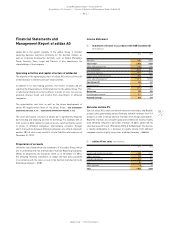
56
/
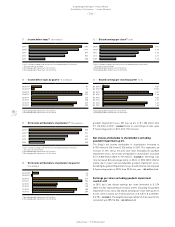
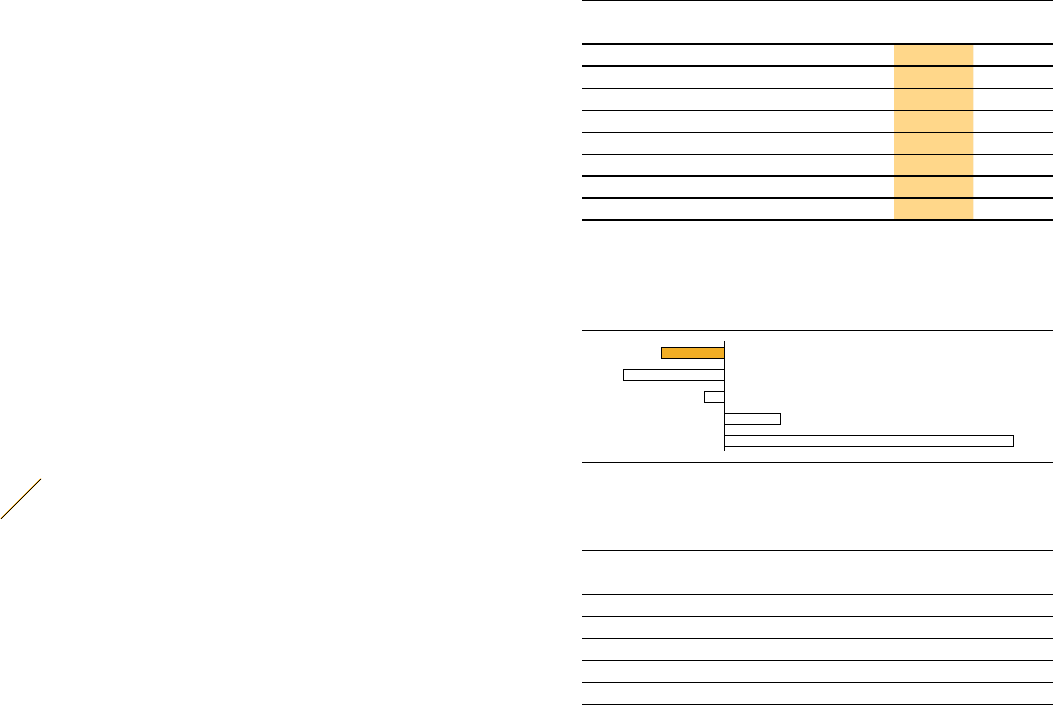
Financial leverage (in %)
2013 (5.3)
2012 (8.5)
2011 (1.7)
2010 4.8
2009 24.3
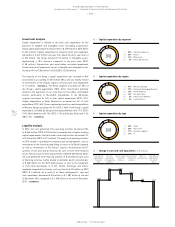
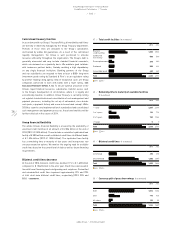
57
/
Issued bonds at a glance (in millions)
Issued bonds Volume Coupon Maturity
Eurobond EUR 500 fixed 2014
German private placement EUR 56 fixed 2014
US private placement USD 115 fixed 2015
US private placement USD 150 fixed 2016
Convertible bond EUR 500 fixed 2019
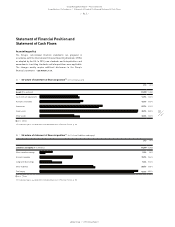
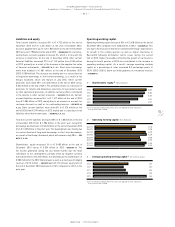
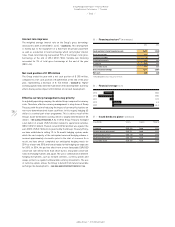
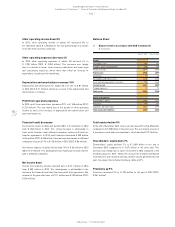
55
/
Financing structure 1) (€ in millions)
2013 2012
Cash and short-term financial assets 1,629 1,935
Bank borrowings 126 59
Commercial paper 0 0
Private placements 248 480
Eurobond 500 499
Convertible bond 460 449
Gross total borrowings 1,334 1,487
Net cash 295 448
1) Rounding differences may arise in totals.
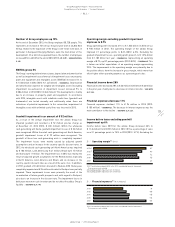
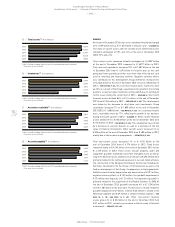
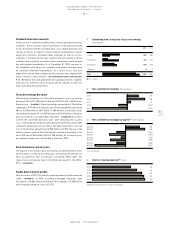
Interest rate improves
The weighted average interest rate on the Group’s gross borrowings
decreased to 3.8% in 2013 (2012: 4.4%)
/
DIAGRAM 54. This development
is mainly due to the repayment of a fixed-rate US private placement
as well as a reduction in local borrowings which carry higher interest
rates. Fixed-rate financing represented 91% of the Group’s total gross
borrowings at the end of 2013 (2012: 96%). Variable-rate financing
accounted for 9% of total gross borrowings at the end of the year
(2012: 4%).
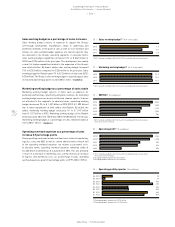
Net cash position of € 295 million
The Group ended the year with a net cash position of € 295 million,
compared to a net cash position of € 448 million at the end of the prior
year, representing a decrease of € 153 million
/
DIAGRAM 52. Higher
working capital needs were the main driver of this development. Currency
effects had a positive impact of € 3 million on net cash development.
Effective currency management a key priority
As a globally operating company, the adidas Group is exposed to currency
risks. Therefore, effective currency management is a key focus of Group
Treasury, with the aim of reducing the impact of currency fluctuations on
non-euro-denominated net future cashflows. In this regard, hedging US
dollars is a central part of our programme. This is a direct result of the
Group’s Asian-dominated sourcing, which is largely denominated in US
dollars
/
SEE GLOBAL OPERATIONS, P. 94. In 2013, Group Treasury managed
a net deficit of around US $ 5.2 billion related to operational activities
(2012: US $ 5.1 billion). Thereof, around US $ 2.6 billion was against the
euro (2012: US $ 2.7 billion). As governed by the Group’s Treasury Policy,
we have established a rolling 12- to 24-month hedging system, under
which the vast majority of the anticipated seasonal hedging volume is
secured approximately six months prior to the start of a season. As a
result, we have almost completed our anticipated hedging needs for
2014 as of year-end 2013 and have already started hedging our exposure
for 2015. In 2014, the positive effect from a more favourable EUR/USD
conversion rate will be more than offset by less favourable conversion
rates in emerging markets and Japan. The use or combination of different
hedging instruments, such as forward contracts, currency options and
swaps, protects us against unfavourable currency movements. The use
of currency options allows the Group to benefit from future favourable
exchange rate developments
/
SEE RISK AND OPPORTUNITY REPORT, P. 158.