Reebok 2013 Annual Report Download - page 185
Download and view the complete annual report
Please find page 185 of the 2013 Reebok annual report below. You can navigate through the pages in the report by either clicking on the pages listed below, or by using the keyword search tool below to find specific information within the annual report.-
 1
1 -
2
-
3
-
4
-
5
-
6
-
7
-
8
-
9
-
10
-
11
-
12
-
13
-
14
-
15
-
16
-
17
-
18
-
19
-
20
-
21
-
22
-
23
-
24
-
25
-
26
-
27
-
28
-
29
-
30
-
31
-
32
-
33
-
34
-
35
-
36
-
37
-
38
-
39
-
40
-
41
-
42
-
43
-
44
-
45
-
46
-
47
-
48
-
49
-
50
-
51
-
52
-
53
-
54
-
55
-
56
-
57
-
58
-
59
-
60
-
61
-
62
-
63
-
64
-
65
-
66
-
67
-
68
-
69
-
70
-
71
-
72
-
73
-
74
-
75
-
76
-
77
-
78
-
79
-
80
-
81
-
82
-
83
-
84
-
85
-
86
-
87
-
88
-
89
-
90
-
91
-
92
-
93
-
94
-
95
-
96
-
97
-
98
-
99
-
100
-
101
-
102
-
103
-
104
-
105
-
106
-
107
-
108
-
109
-
110
-
111
-
112
-
113
-
114
-
115
-
116
-
117
-
118
-
119
-
120
-
121
-
122
-
123
-
124
-
125
-
126
-
127
-
128
-
129
-
130
-
131
-
132
-
133
-
134
-
135
-
136
-
137
-
138
-
139
-
140
-
141
-
142
-
143
-
144
-
145
-
146
-
147
-
148
-
149
-
150
-
151
-
152
-
153
-
154
-
155
-
156
-
157
-
158
-
159
-
160
-
161
-
162
-
163
-
164
-
165
-
166
-
167
-
168
-
169
-
170
-
171
-
172
-
173
-
174
-
 175
175 -
 176
176 -
 177
177 -
 178
178 -
 179
179 -
 180
180 -
 181
181 -
 182
182 -
 183
183 -
 184
184 -
 185
185 -
 186
186 -
 187
187 -
 188
188 -
 189
189 -
 190
190 -
 191
191 -
 192
192 -
 193
193 -
 194
194 -
 195
195 -
196
-
197
-
198
-
199
-
200
-
201
-
202
-
203
-
204
-
205
-
206
-
207
-
208
-
209
-
210
-
211
-
212
-
213
-
214
-
215
-
216
-
217
-
218
-
219
-
220
-
221
-
222
-
223
-
224
-
225
-
226
-
227
-
228
-
229
-
230
-
231
-
232
-
233
-
234
-
235
-
236
-
237
-
238
-
239
-
240
-
241
-
242
-
243
-
244
-
245
-
246
-
247
-
248
-
249
-
250
-
251
-
252
-
253
-
254
-
255
-
256
-
257
-
258
-
259
-
260
-
261
-
262
-
263
-
264
 |
 |
adidas Group
/
2013 Annual Report
Group Management Report – Financial Review
181
2013
Management Assessment of Performance, Risks and Opportunities, and Outlook
/
03.6
/
Assessment of overall risks and opportunities
The Group’s Risk Management team aggregates all risks and
opportunities reported by different business units and functions through
the quarterly risk and opportunity assessment process. In addition,
the Group’s Executive Board discusses and assesses Group risks and
opportunities on a regular basis. Taking into account the potential
financial impact as well as the likelihood of materialising of the risks
explained within this report, and considering the strong balance
sheet as well as the current business outlook, we do not foresee any
material jeopardy to the viability of the Group as a going concern. This
assessment is also supported by the historical response to our financing
demands
/
SEE TREASURY, P. 135. The adidas Group therefore has not
sought an official rating by any of the leading rating agencies. We remain
confident that the Group’s earnings strength forms a solid basis for our
future business development and provides the resources necessary
to pursue the opportunities available to the Group. Compared to the
prior year, our assessment of certain risks has changed in terms of
likelihood of occurrence and/or potential financial impact
/
SEE RISK AND
OPPORTUNITY REPORT, P. 158. The partial changes in risk evaluation have
no substantial impact on the overall adidas Group risk profile; however,
we believe that the current development of major currencies since the
beginning of 2014 will make the achievement of our financial targets for
2014 and 2015 significantly more challenging to meet.
Assessment of financial outlook
Since the adidas Group publicly announced its Route 2015 strategic
business plan in 2010, we have made good progress towards our Route
2015 aspirations. We remain focused on creating long-term sustainable
shareholder value and continue to pursue all targets with utmost
diligence.
In 2014, we will see a specific emphasis on returning our Group to
higher currency-neutral growth rates than seen in 2013, while also
continuing to pursue initiatives to improve our Group’s operating margin
in the medium to long term. We will also continue to invest in future
growth opportunities by utilising the upcoming 2014 FIFA World Cup
and innovation platforms such as Boost, expanding our digital activities
as well as opening new retail stores
/
SEE GLOBAL BRANDS STRATEGY,
P. 77
/
GLOBAL SALES STRATEGY, P. 72.
Through our extensive pipeline of new and innovative products, which
have received favourable reviews from retailers, we project top- and
bottom-line improvements in our Group’s financial results in 2014. This
is supported by positive order backlogs and improving comparable store
growth trends in our own-retail stores compared to the prior year. Gross
margin expansion, resulting from a more favourable pricing, product and
regional sales mix, is expected to have a positive impact on the Group’s
profitability. In addition, we project that other operating expenses as a
percentage of sales will be around the prior year level. We believe that
our outlook for 2014 is realistic within the scope of the current trading
and economic environment
/
SEE SUBSEQUENT EVENTS AND OUTLOOK, P. 151.
Assuming no significant deterioration in the global economy, we are
confident to further increase sales and profitability in 2015, as we
continue to drive operational progress towards our Route 2015 strategic
business plan aspirations
/
SEE GROUP STRATEGY, P. 68. However, given
further headwinds from the weakening of several currencies versus
the euro since the beginning of 2014, we believe there is higher risk to
the achievement of our stated financial goals and aspirations than in
prior years. No other material event between the end of 2013 and the
publication of this report has altered our view.
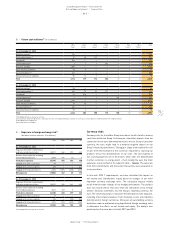
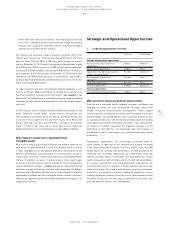
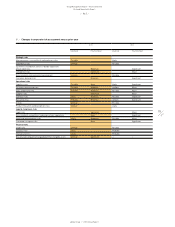
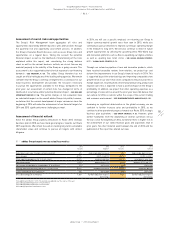
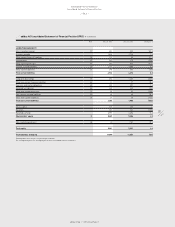
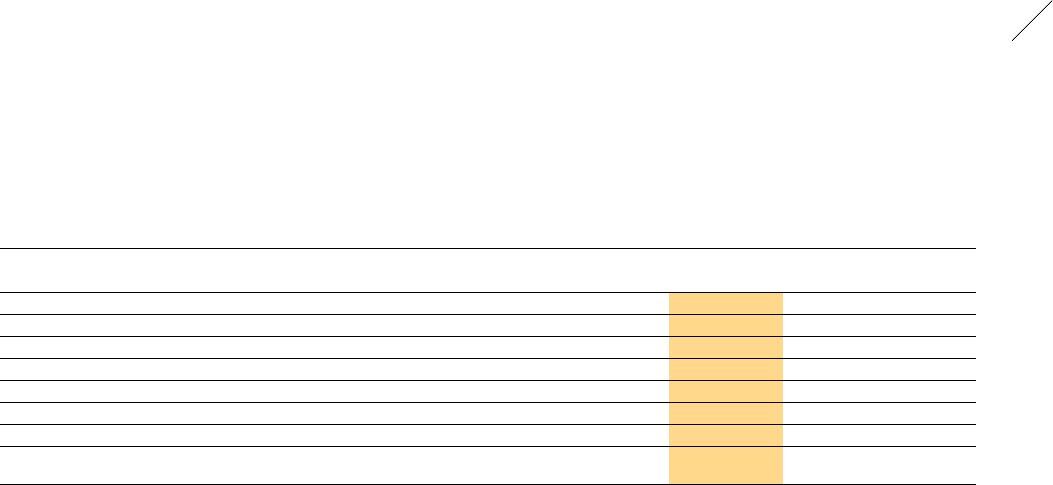
01
/
adidas Group targets versus actual key metrics
2012
Results
2013
Targets 1)
2013
Results
2014
Outlook
Sales (year-over-year change, currency-neutral) 6% mid-single-digit increase 3% high-single-digit increase
Gross margin 47.7% 48.0% to 48.5% 49.3% 49.5% to 49.8%
Other operating expenses (in % of net sales) 41.3% moderate decline 42.3% around prior year level
Operating margin 8.0% 2) approaching 9.0% 8.7% 3) between 8.5% and 9.0%
Net income attributable to shareholders (€ in millions) 791 2) 890 to 920 839 3) 830 to 930
Average operating working capital (in % of net sales) 20.0% moderate increase 20.9% moderate decline
Capital expenditure (€ in millions) 4) 434 500 to 550 479 500 to 550
Gross borrowings (€ in millions) 1,487 further reduction of gross
borrowings
1,334 further reduction of gross
borrowings
1) As published on March 7, 2013. The outlook was updated over the course of the year.
2) Excluding goodwill impairment of € 265 million.
3) Excluding goodwill impairment of € 52 million.
4) Excluding acquisitions and finance leases.