Reebok 2013 Annual Report Download - page 132
Download and view the complete annual report
Please find page 132 of the 2013 Reebok annual report below. You can navigate through the pages in the report by either clicking on the pages listed below, or by using the keyword search tool below to find specific information within the annual report.-
 1
1 -
2
-
3
-
4
-
5
-
6
-
7
-
8
-
9
-
10
-
11
-
12
-
13
-
14
-
15
-
16
-
17
-
18
-
19
-
20
-
21
-
22
-
23
-
24
-
25
-
26
-
27
-
28
-
29
-
30
-
31
-
32
-
33
-
34
-
35
-
36
-
37
-
38
-
39
-
40
-
41
-
42
-
43
-
44
-
45
-
46
-
47
-
48
-
49
-
50
-
51
-
52
-
53
-
54
-
55
-
56
-
57
-
58
-
59
-
60
-
61
-
62
-
63
-
64
-
65
-
66
-
67
-
68
-
69
-
70
-
71
-
72
-
73
-
74
-
75
-
76
-
77
-
78
-
79
-
80
-
81
-
82
-
83
-
84
-
85
-
86
-
87
-
88
-
89
-
90
-
91
-
92
-
93
-
94
-
95
-
96
-
97
-
98
-
99
-
100
-
101
-
102
-
103
-
104
-
105
-
106
-
107
-
108
-
109
-
110
-
111
-
112
-
113
-
114
-
115
-
116
-
117
-
118
-
119
-
120
-
121
-
 122
122 -
 123
123 -
 124
124 -
 125
125 -
 126
126 -
 127
127 -
 128
128 -
 129
129 -
 130
130 -
 131
131 -
 132
132 -
 133
133 -
 134
134 -
 135
135 -
 136
136 -
 137
137 -
 138
138 -
 139
139 -
 140
140 -
 141
141 -
 142
142 -
143
-
144
-
145
-
146
-
147
-
148
-
149
-
150
-
151
-
152
-
153
-
154
-
155
-
156
-
157
-
158
-
159
-
160
-
161
-
162
-
163
-
164
-
165
-
166
-
167
-
168
-
169
-
170
-
171
-
172
-
173
-
174
-
175
-
176
-
177
-
178
-
179
-
180
-
181
-
182
-
183
-
184
-
185
-
186
-
187
-
188
-
189
-
190
-
191
-
192
-
193
-
194
-
195
-
196
-
197
-
198
-
199
-
200
-
201
-
202
-
203
-
204
-
205
-
206
-
207
-
208
-
209
-
210
-
211
-
212
-
213
-
214
-
215
-
216
-
217
-
218
-
219
-
220
-
221
-
222
-
223
-
224
-
225
-
226
-
227
-
228
-
229
-
230
-
231
-
232
-
233
-
234
-
235
-
236
-
237
-
238
-
239
-
240
-
241
-
242
-
243
-
244
-
245
-
246
-
247
-
248
-
249
-
250
-
251
-
252
-
253
-
254
-
255
-
256
-
257
-
258
-
259
-
260
-
261
-
262
-
263
-
264
 |
 |
adidas Group
/
2013 Annual Report
Group Management Report – Financial Review
128
2013
/
03.2
/
Group Business Performance
/
Income Statement
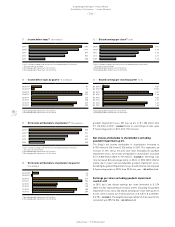
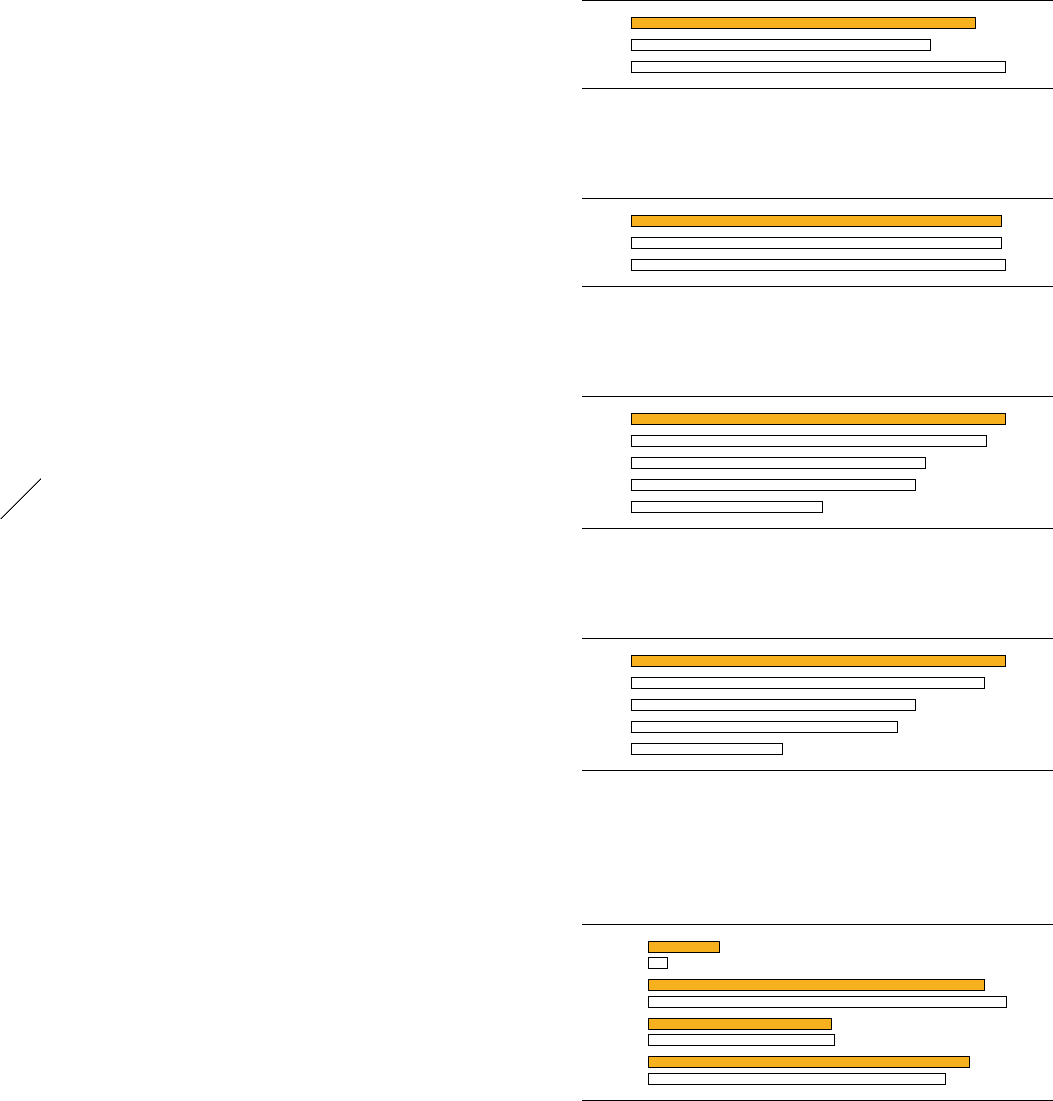
20
/
Sales working budget 1) (in % of net sales)
2013 2.3
2012 2.0
2011 2.5
1) 2011 restated according to IAS 8 in the 2012 consolidated financial statements.
21
/
Marketing working budget 1) (in % of net sales)
2013 10.1
2012 10.1
2011 10.2
1) 2011 restated according to IAS 8 in the 2012 consolidated financial statements.
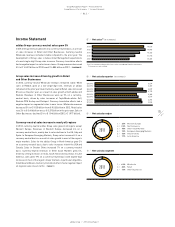
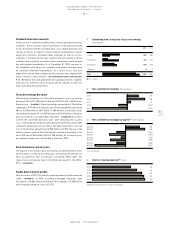
22
/
EBITDA 1) (€ in millions)
2013 1,523
2012 1,445
2011 1,199
2010 1,159
2009 780
1) 2011 restated according to IAS 8 in the 2012 consolidated financial statements.
Prior years are not restated.
23
/
Operating profit 1) (€ in millions)
2013 2) 1,254
2012 3) 1,185
2011 953
2010 894
2009 508
1) 2011 restated according to IAS 8 in the 2012 consolidated financial statements.
Prior years are not restated.
2) Excluding goodwill impairment of € 52 million.
3) Excluding goodwill impairment of € 265 million.
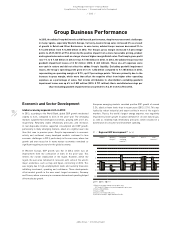
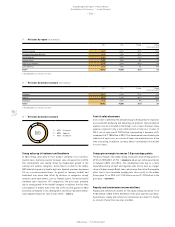
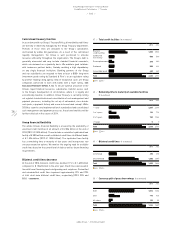
Sales working budget as a percentage of sales increases
Sales working budget consists of expenses to support the Group’s
sell-through development. Expenditures relate to advertising and
promotion initiatives at the point of sale as well as store furniture and
fixtures. As sales working budget expenses are channel specific, they
are allocated to the Group’s operating segments. In absolute terms,
sales working budget expenditure increased 12% to € 340 million in
2013 from € 304 million in the prior year. This development was mainly
a result of higher expenditure related to the expansion of the Group’s
own-retail activities. By brand, adidas sales working budget increased
15% to € 253 million compared to € 220 million in the prior year. Sales
working budget for Reebok grew 7% to € 53 million at year-end (2012:
€ 50 million). The Group’s sales working budget as a percentage of sales
increased 0.3 percentage points to 2.3% (2012: 2.0%)
/
DIAGRAM 20.
Marketing working budget as a percentage of sales stable
Marketing working budget consists of items such as expenses for
promotion partnerships, advertising and public relations. As marketing
working budget expenses are not distribution channel specific, they are
not allocated to the segments. In absolute terms, marketing working
budget decreased 3% to € 1.457 billion in 2013 (2012: € 1.502 billion)
due to lower expenditure at both adidas and Reebok. By brand, the
adidas marketing working budget decreased 1% to € 1.147 billion
from € 1.157 billion in 2012. Marketing working budget of the Reebok
brand was down 20% to € 150 million (2012: € 188 million). The Group’s
marketing working budget as a percentage of sales remained stable at
10.1% (2012: 10.1%)
/
DIAGRAM 21.
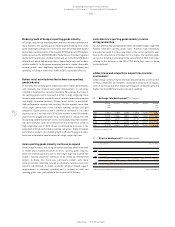
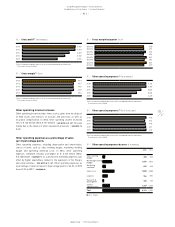
Operating overhead expenses as a percentage of sales
increase 0.7 percentage points
Group operating overheads include overhead costs related to marketing,
logistics, sales and R&D as well as central administration. Almost half
of the operating overhead expenses are related to personnel costs.
In absolute terms, operating overhead expenses remained stable at
€ 4.336 billion in 2013 versus € 4.344 billion in 2012. This was primarily
a result of a decrease in marketing costs, partly offset by an increase
in logistics and warehouse costs. As a percentage of sales, operating
overhead expenses grew 0.7 percentage points to 29.9% (2012: 29.2%).
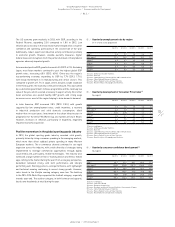
24
/
Operating profit by quarter (€ in millions)
Q4 2013 1) 98
Q4 2012 2) 26
Q3 2013 463
Q3 2012 494
Q2 2013 252
Q2 2012 256
Q1 2013 442
Q1 2012 409
1) Excluding goodwill impairment of € 52 million.
2) Excluding goodwill impairment of € 265 million.