Reebok 2013 Annual Report Download - page 127
Download and view the complete annual report
Please find page 127 of the 2013 Reebok annual report below. You can navigate through the pages in the report by either clicking on the pages listed below, or by using the keyword search tool below to find specific information within the annual report.-
 1
1 -
2
-
3
-
4
-
5
-
6
-
7
-
8
-
9
-
10
-
11
-
12
-
13
-
14
-
15
-
16
-
17
-
18
-
19
-
20
-
21
-
22
-
23
-
24
-
25
-
26
-
27
-
28
-
29
-
30
-
31
-
32
-
33
-
34
-
35
-
36
-
37
-
38
-
39
-
40
-
41
-
42
-
43
-
44
-
45
-
46
-
47
-
48
-
49
-
50
-
51
-
52
-
53
-
54
-
55
-
56
-
57
-
58
-
59
-
60
-
61
-
62
-
63
-
64
-
65
-
66
-
67
-
68
-
69
-
70
-
71
-
72
-
73
-
74
-
75
-
76
-
77
-
78
-
79
-
80
-
81
-
82
-
83
-
84
-
85
-
86
-
87
-
88
-
89
-
90
-
91
-
92
-
93
-
94
-
95
-
96
-
97
-
98
-
99
-
100
-
101
-
102
-
103
-
104
-
105
-
106
-
107
-
108
-
109
-
110
-
111
-
112
-
113
-
114
-
115
-
116
-
 117
117 -
 118
118 -
 119
119 -
 120
120 -
 121
121 -
 122
122 -
 123
123 -
 124
124 -
 125
125 -
 126
126 -
 127
127 -
 128
128 -
 129
129 -
 130
130 -
 131
131 -
 132
132 -
 133
133 -
 134
134 -
 135
135 -
 136
136 -
 137
137 -
138
-
139
-
140
-
141
-
142
-
143
-
144
-
145
-
146
-
147
-
148
-
149
-
150
-
151
-
152
-
153
-
154
-
155
-
156
-
157
-
158
-
159
-
160
-
161
-
162
-
163
-
164
-
165
-
166
-
167
-
168
-
169
-
170
-
171
-
172
-
173
-
174
-
175
-
176
-
177
-
178
-
179
-
180
-
181
-
182
-
183
-
184
-
185
-
186
-
187
-
188
-
189
-
190
-
191
-
192
-
193
-
194
-
195
-
196
-
197
-
198
-
199
-
200
-
201
-
202
-
203
-
204
-
205
-
206
-
207
-
208
-
209
-
210
-
211
-
212
-
213
-
214
-
215
-
216
-
217
-
218
-
219
-
220
-
221
-
222
-
223
-
224
-
225
-
226
-
227
-
228
-
229
-
230
-
231
-
232
-
233
-
234
-
235
-
236
-
237
-
238
-
239
-
240
-
241
-
242
-
243
-
244
-
245
-
246
-
247
-
248
-
249
-
250
-
251
-
252
-
253
-
254
-
255
-
256
-
257
-
258
-
259
-
260
-
261
-
262
-
263
-
264
 |
 |

adidas Group
/
2013 Annual Report
Group Management Report – Financial Review
123
2013
/
03.2
/
Group Business Performance
/
Economic and Sector Development
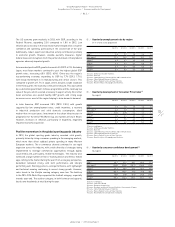
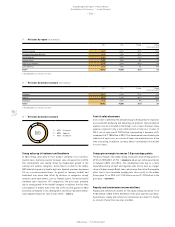
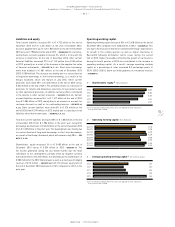
02
/
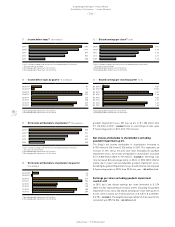
Quarterly unemployment rate by region
(in % of total active population)
Q4 2012 Q1 2013 Q2 2013 Q3 2013 Q4 2013
USA 1) 7.8 7.7 7.5 7.3 7.0
Euro area 2) 11.9 12.0 12.1 12.1 12.0
Japan 3) 4.3 4.1 3.9 4.0 3.7
China 4) 4.1 4.1 4.1 4.0 4.0
Russia 5) 5.1 5.7 5.4 5.3 5.6
Brazil 6) 4.6 5.7 6.0 5.4 4.3
1) Source: US Bureau of Labor Statistics.
2) Source: Eurostat.
3) Source: Japan Ministry of Internal Affairs and Communications.
4) Source: China National Bureau of Statistics.
5) Source: Russia Federal Service of State Statistics.
6) Source: Brazil Institute of Geography and Statistics.
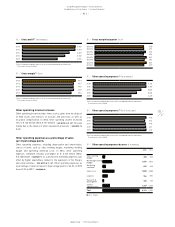
03
/
Quarterly development of Consumer Price Index 1)
(by region)
Q4 2012 Q1 2013 Q2 2013 Q3 2013 Q4 2013
USA 2) 1.7 1.5 1.8 1.2 1.5
Euro area 3) 2.2 1.7 1.6 1.1 0.8
Japan 4) (0.1) (0.9) 0.2 1.1 1.6
China 5) 2.5 2.1 2.7 3.1 2.5
Russia 6) 6.6 7.0 6.9 6.1 6.5
Brazil 7) 5.8 6.6 6.7 5.9 5.9
1) Quarter-end figures.
2) Source: US Bureau of Labor Statistics.
3) Source: Eurostat.
4) Source: Japan Ministry of Internal Affairs and Communications.
5) Source: China National Bureau of Statistics.
6) Source: Russia Federal Service of State Statistics.
7) Source: Brazil Institute of Geography and Statistics.
04
/
Quarterly consumer confidence development 1)
(by region)
Q4 2012 Q1 2013 Q2 2013 Q3 2013 Q4 2013
USA 2) 66.7 61.9 82.1 80.2 77.5
Euro area 3) (26.0) (23.3) (18.7) (14.8) (13.6)
Japan 4) 39.1 45.0 44.3 45.1 40.0
China 5) 103.7 102.6 97.0 99.8 102.3
Russia 6) (8.0) (7.0) (6.0) (7.0) (11.0)
Brazil 7) 115.2 114.3 110.1 110.1 111.2
1) Quarter-end figures.
2) Source: Conference Board.
3) Source: European Commission.
4) Source: Economic and Social Research Institute, Government of Japan.
5) Source: China National Bureau of Statistics.
6) Source: Russia Federal Service of State Statistics.
7) Source: Brazil National Confederation of Industry.
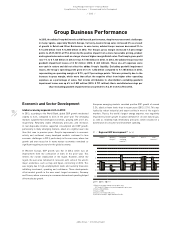
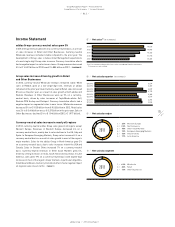
The US economy grew modestly in 2013, with GDP, according to the
Federal Reserve, expanding 2.3% compared to 1.8% in 2012. Low
inflation and a recovery in the real estate market helped drive consumer
confidence and spending, particularly in the second half of the year.
Additionally, robust export and industrial activity contributed positively
to economic growth. However, sizeable austerity measures, higher
federal taxes and disruptions from the partial shutdown of many federal
agencies adversely impacted growth.
Asia recorded positive GDP growth of around 4.3% (2012: 4.2%). Excluding
Japan, most Asian markets continued to post the highest global GDP
growth rates, increasing 6.0% (2012: 6.0%). China was the region’s
top-performing economy, expanding its GDP by 7.7% (2012: 7.7%),
with steady momentum in its manufacturing and service sectors. This
compared to growth of 1.7% in Japan, where, despite a slight slowdown
in the third quarter, the economy continued to rebound. This was fuelled
by a substantial government stimulus programme and the relatively low
value of the yen, which assisted a recovery in export activity. Most other
Asian economies also posted healthy GDP growth, with strong wage
increases across most of the region helping to drive domestic demand.
In Latin America, GDP increased 2.0% (2012: 2.5%), with growth
supported by low unemployment rates, credit incentives, a recovery
in industrial production and solid domestic consumption, albeit
weaker than in recent years. Investment in the urban infrastructure in
preparation for the 2014 FIFA World Cup also fuelled activity in Brazil.
However, increases in inflation, particularly in Argentina, negatively
impacted economic expansion.
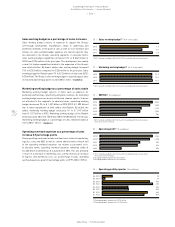
Positive momentum in the global sporting goods industry
In 2013, the global sporting goods industry recorded solid growth,
primarily driven by rising consumer spending in the emerging markets,
which more than offset subdued private spending in many Western
European markets. The e-commerce channel continued to see rapid
expansion across the industry, with a wide diversity of strategies being
implemented to leverage commercial opportunities through digital,
social media and, particularly, mobile technologies. The industry also
witnessed a large number of fitness-tracking devices and fitness mobile
apps coming to the market during the year. From a category perspective,
basketball remained strong, with both performance and lifestyle
performing well. Running posted a solid performance, with lightweight
and technical running continuing to record strong growth. However,
sales trends in the lifestyle running category were low. The build-up
to the 2014 FIFA World Cup supported the football category, especially
towards year-end. The outdoor category, in both footwear and apparel,
faced some headwinds at retail during the year.