Reebok 2013 Annual Report Download - page 62
Download and view the complete annual report
Please find page 62 of the 2013 Reebok annual report below. You can navigate through the pages in the report by either clicking on the pages listed below, or by using the keyword search tool below to find specific information within the annual report.-
 1
1 -
2
-
3
-
4
-
5
-
6
-
7
-
8
-
9
-
10
-
11
-
12
-
13
-
14
-
15
-
16
-
17
-
18
-
19
-
20
-
21
-
22
-
23
-
24
-
25
-
26
-
27
-
28
-
29
-
30
-
31
-
32
-
33
-
34
-
35
-
36
-
37
-
38
-
39
-
40
-
41
-
42
-
43
-
44
-
45
-
46
-
47
-
48
-
49
-
50
-
51
-
 52
52 -
 53
53 -
 54
54 -
 55
55 -
 56
56 -
 57
57 -
 58
58 -
 59
59 -
 60
60 -
 61
61 -
 62
62 -
 63
63 -
 64
64 -
 65
65 -
 66
66 -
 67
67 -
 68
68 -
 69
69 -
 70
70 -
 71
71 -
 72
72 -
73
-
74
-
75
-
76
-
77
-
78
-
79
-
80
-
81
-
82
-
83
-
84
-
85
-
86
-
87
-
88
-
89
-
90
-
91
-
92
-
93
-
94
-
95
-
96
-
97
-
98
-
99
-
100
-
101
-
102
-
103
-
104
-
105
-
106
-
107
-
108
-
109
-
110
-
111
-
112
-
113
-
114
-
115
-
116
-
117
-
118
-
119
-
120
-
121
-
122
-
123
-
124
-
125
-
126
-
127
-
128
-
129
-
130
-
131
-
132
-
133
-
134
-
135
-
136
-
137
-
138
-
139
-
140
-
141
-
142
-
143
-
144
-
145
-
146
-
147
-
148
-
149
-
150
-
151
-
152
-
153
-
154
-
155
-
156
-
157
-
158
-
159
-
160
-
161
-
162
-
163
-
164
-
165
-
166
-
167
-
168
-
169
-
170
-
171
-
172
-
173
-
174
-
175
-
176
-
177
-
178
-
179
-
180
-
181
-
182
-
183
-
184
-
185
-
186
-
187
-
188
-
189
-
190
-
191
-
192
-
193
-
194
-
195
-
196
-
197
-
198
-
199
-
200
-
201
-
202
-
203
-
204
-
205
-
206
-
207
-
208
-
209
-
210
-
211
-
212
-
213
-
214
-
215
-
216
-
217
-
218
-
219
-
220
-
221
-
222
-
223
-
224
-
225
-
226
-
227
-
228
-
229
-
230
-
231
-
232
-
233
-
234
-
235
-
236
-
237
-
238
-
239
-
240
-
241
-
242
-
243
-
244
-
245
-
246
-
247
-
248
-
249
-
250
-
251
-
252
-
253
-
254
-
255
-
256
-
257
-
258
-
259
-
260
-
261
-
262
-
263
-
264
 |
 |
10
adidas Group
/
2013 Annual Report
To Our Shareholders
58
2013
/
01.10
/
Our Share
Our Share
In 2013, international stock markets and the adidas AG share continued their bullish run from the prior
year and increased considerably. Global central banks’ promise to keep key rates low for an extended
period of time (Forward Guidance), the recovery of the US economy as well as the stabilisation of
the euro area economy were key catalysts for strong market developments throughout the year.
Discussions about a possible tapering by the Fed, the lacklustre earnings seasons, the looming US
government shutdown as well as geopolitical risk factors in certain regions only temporarily weighed
on equity markets. This resulted in an increase of 25% in 2013 for both the DAX-30 and the MSCI World
Textiles, Apparel & Luxury Goods Index. The adidas AG share outperformed both indices, supported
by ongoing strong performance in emerging markets and market participants’ rising confidence in the
adidas Group’s Route 2015 strategic business plan. This more than offset a temporary weakness in the
share price following the amendment of the adidas Group’s full year guidance during the third quarter.
As a result, at year-end the adidas AG share reached a new all-time high of € 92.64, representing an
increase of 38% compared to the prior year. With the increase in the Group’s net income attributable to
shareholders excluding impairment losses, we intend to propose an 11% higher dividend compared to
2012 at our 2014 Annual General Meeting.
International stock markets maintain positive momentum
In 2013, international stock markets maintained the positive momentum
from the previous year, which resulted in new all-time highs for the
DAX-30 and the Dow Jones. At the beginning of 2013, US equity markets
improved considerably, supported by the last-minute US fiscal cliff deal,
strong US economic data and a better than expected US earnings season.
European benchmark indices, however, underperformed international
equity markets due to setbacks in the euro debt crisis, in particular the
bailout package for Cyprus as well as the impending political deadlock
in Italy. In the second quarter of 2013, equity markets continued their
bullish run, supported by the ongoing accommodative monetary policy
of the major central banks. This, combined with improving US economic
indicators, as well as the ECB’s decision to further cut its key interest
rate by 25 basis points to 0.5%, drove the DAX-30 and US equity markets
to new all-time highs at the beginning of May. However, signals that the
Fed could reduce its monetary stimulus, together with disappointing
economic data in China, resulted in a consolidation of equity markets
towards the end of the second quarter. In the third quarter of 2013,
international stock markets improved significantly. The key catalyst of
the uptrend was the recovery of leading economic indicators as well as
ongoing accommodative monetary policies of the ECB and the Fed. This
more than offset the negative impact of a lacklustre Q2 earnings season,
the looming US government shutdown as well as geopolitical risk factors
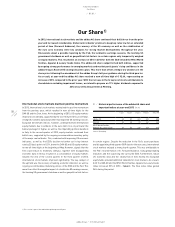
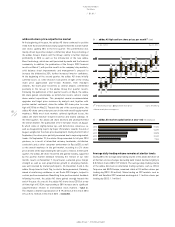
01
/
Historical performance of the adidas AG share and
important indices at year-end 2013 (in %)
1 year 3 years 5 years 10 years Since IPO
adidas AG 38 89 241 310 858
DAX-30 25 38 99 141 335
MSCI World Textiles,
Apparel & Luxury Goods 25 50 230 259 415
Source: Bloomberg.
in certain regions. Despite the reduction in the Fed’s asset purchases
and disappointing third quarter GDP data for the euro area, international
stock markets enjoyed a strong fourth quarter. This was attributable to
the Fed’s reconfirmation of its Forward Guidance, rising global leading
indicators and the surprising rate cut by the ECB. Furthermore, robust
US economic data and the steady flow of new money into European
equity funds provided additional tailwinds for stock markets. As a result,
both the DAX-30 and the MSCI World Textiles, Apparel & Luxury Goods
Index increased 25% in 2013
/
TABLE 01. The Dow Jones Index gained
26% during the period.
1)
1) This section is part of the audited Group Management Report.