Reebok 2013 Annual Report Download - page 130
Download and view the complete annual report
Please find page 130 of the 2013 Reebok annual report below. You can navigate through the pages in the report by either clicking on the pages listed below, or by using the keyword search tool below to find specific information within the annual report.-
 1
1 -
2
-
3
-
4
-
5
-
6
-
7
-
8
-
9
-
10
-
11
-
12
-
13
-
14
-
15
-
16
-
17
-
18
-
19
-
20
-
21
-
22
-
23
-
24
-
25
-
26
-
27
-
28
-
29
-
30
-
31
-
32
-
33
-
34
-
35
-
36
-
37
-
38
-
39
-
40
-
41
-
42
-
43
-
44
-
45
-
46
-
47
-
48
-
49
-
50
-
51
-
52
-
53
-
54
-
55
-
56
-
57
-
58
-
59
-
60
-
61
-
62
-
63
-
64
-
65
-
66
-
67
-
68
-
69
-
70
-
71
-
72
-
73
-
74
-
75
-
76
-
77
-
78
-
79
-
80
-
81
-
82
-
83
-
84
-
85
-
86
-
87
-
88
-
89
-
90
-
91
-
92
-
93
-
94
-
95
-
96
-
97
-
98
-
99
-
100
-
101
-
102
-
103
-
104
-
105
-
106
-
107
-
108
-
109
-
110
-
111
-
112
-
113
-
114
-
115
-
116
-
117
-
118
-
119
-
 120
120 -
 121
121 -
 122
122 -
 123
123 -
 124
124 -
 125
125 -
 126
126 -
 127
127 -
 128
128 -
 129
129 -
 130
130 -
 131
131 -
 132
132 -
 133
133 -
 134
134 -
 135
135 -
 136
136 -
 137
137 -
 138
138 -
 139
139 -
 140
140 -
141
-
142
-
143
-
144
-
145
-
146
-
147
-
148
-
149
-
150
-
151
-
152
-
153
-
154
-
155
-
156
-
157
-
158
-
159
-
160
-
161
-
162
-
163
-
164
-
165
-
166
-
167
-
168
-
169
-
170
-
171
-
172
-
173
-
174
-
175
-
176
-
177
-
178
-
179
-
180
-
181
-
182
-
183
-
184
-
185
-
186
-
187
-
188
-
189
-
190
-
191
-
192
-
193
-
194
-
195
-
196
-
197
-
198
-
199
-
200
-
201
-
202
-
203
-
204
-
205
-
206
-
207
-
208
-
209
-
210
-
211
-
212
-
213
-
214
-
215
-
216
-
217
-
218
-
219
-
220
-
221
-
222
-
223
-
224
-
225
-
226
-
227
-
228
-
229
-
230
-
231
-
232
-
233
-
234
-
235
-
236
-
237
-
238
-
239
-
240
-
241
-
242
-
243
-
244
-
245
-
246
-
247
-
248
-
249
-
250
-
251
-
252
-
253
-
254
-
255
-
256
-
257
-
258
-
259
-
260
-
261
-
262
-
263
-
264
 |
 |
adidas Group
/
2013 Annual Report
Group Management Report – Financial Review
126
2013
/
03.2
/
Group Business Performance
/
Income Statement
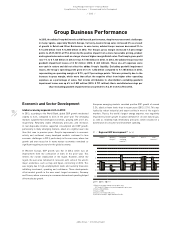
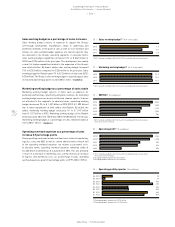
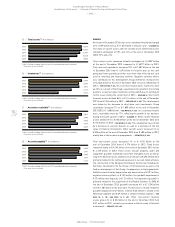
Group sales up in footwear and hardware
In 2013, Group sales grew in most product categories on a currency-
neutral basis. Currency-neutral footwear sales increased 4% in 2013.
This development was mainly driven by double-digit growth in the
running and outdoor categories. Action Sports as well as the adidas
NEO label also grew at a double-digit rate. Apparel revenues decreased
3% on a currency-neutral basis, as growth in running, football and
basketball was more than offset by declines in categories closely
related to prior year events, such as Olympic sports. Currency-neutral
hardware sales increased 15% compared to the prior year, primarily
due to strong growth in the football category. In addition, the first-time
consolidation of Adams Golf at the end of the second quarter of 2012
positively contributed to this development. Currency translation effects
had a negative impact on sales in euro terms
/
TABLE 12.
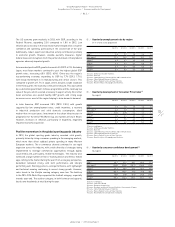
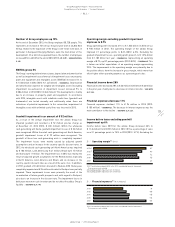
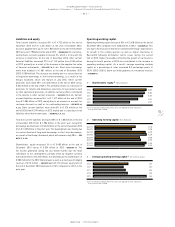
Cost of sales decreases
Cost of sales is defined as the amount we pay to third parties for expenses
associated with producing and delivering our products. Own-production
expenses are also included in the Group’s cost of sales. However, these
expenses represent only a very small portion of total cost of sales. In
2013, cost of sales was € 7.352 billion, representing a decrease of 5%
compared to € 7.780 billion in 2012. This development was driven by the
reduction of input costs as a result of lower raw material prices at the
time of sourcing. In addition, currency effects contributed to the decline
in cost of sales.
Group gross margin increases 1.5 percentage points
The gross margin of the adidas Group increased 1.5 percentage points to
49.3% in 2013 (2012: 47.7%)
/
DIAGRAM 15, above our initial expectations
of between 48.0% and 48.5%. This development was due to a more
favourable pricing, product and regional sales mix as well as a larger
share of higher-margin Retail sales, which more than offset the negative
effect from a less favourable hedging rate. Gross profit for the adidas
Group grew 1% in 2013 to € 7.140 billion versus € 7.103 billion in the
prior year
/
DIAGRAM 14.
Royalty and commission income declines
Royalty and commission income for the adidas Group decreased 1% to
€ 104 million in 2013 from € 105 million in the prior year. On a currency-
neutral basis, royalty and commission income was also down 1%, mainly
as a result of lower licensee sales at adidas.
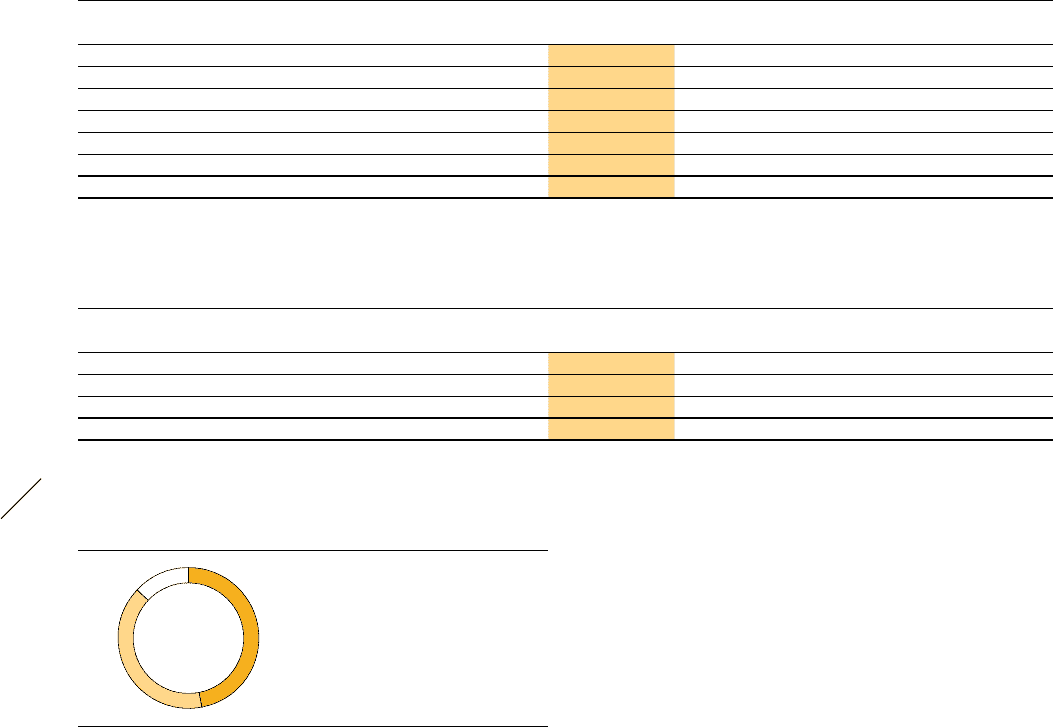
11
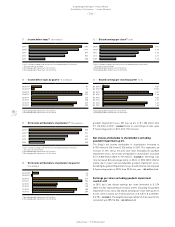
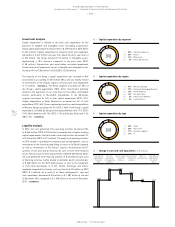
/
Net sales by region (€ in millions)
2013 2012 Change Change
(currency-neutral)
Western Europe 3,800 4,076 (7%) (6%)
European Emerging Markets 1,894 1,947 (3%) 4%
North America 3,362 3,410 (1%) 2%
Greater China 1,655 1,562 6% 7%
Other Asian Markets 2,206 2,407 (8%) 5%
Latin America 1,575 1,481 6% 19%
Total 1) 14,492 14,883 (3%) 3%
1) Rounding differences may arise in totals.
12
/
Net sales by product category (€ in millions)
2013 2012 Change Change
(currency-neutral)
Footwear 6,873 6,922 (1%) 4%
Apparel 5,813 6,290 (8%) (3%)
Hardware 1,806 1,671 8% 15%
Total 1) 14,492 14,883 (3%) 3%
1) Rounding differences may arise in totals.
13
/
Net sales by product category
2013 1
/
47% Footwear
2
/
40% Apparel
3
/
13% Hardware
1
2
3