Reebok 2013 Annual Report Download - page 144
Download and view the complete annual report
Please find page 144 of the 2013 Reebok annual report below. You can navigate through the pages in the report by either clicking on the pages listed below, or by using the keyword search tool below to find specific information within the annual report.-
 1
1 -
2
-
3
-
4
-
5
-
6
-
7
-
8
-
9
-
10
-
11
-
12
-
13
-
14
-
15
-
16
-
17
-
18
-
19
-
20
-
21
-
22
-
23
-
24
-
25
-
26
-
27
-
28
-
29
-
30
-
31
-
32
-
33
-
34
-
35
-
36
-
37
-
38
-
39
-
40
-
41
-
42
-
43
-
44
-
45
-
46
-
47
-
48
-
49
-
50
-
51
-
52
-
53
-
54
-
55
-
56
-
57
-
58
-
59
-
60
-
61
-
62
-
63
-
64
-
65
-
66
-
67
-
68
-
69
-
70
-
71
-
72
-
73
-
74
-
75
-
76
-
77
-
78
-
79
-
80
-
81
-
82
-
83
-
84
-
85
-
86
-
87
-
88
-
89
-
90
-
91
-
92
-
93
-
94
-
95
-
96
-
97
-
98
-
99
-
100
-
101
-
102
-
103
-
104
-
105
-
106
-
107
-
108
-
109
-
110
-
111
-
112
-
113
-
114
-
115
-
116
-
117
-
118
-
119
-
120
-
121
-
122
-
123
-
124
-
125
-
126
-
127
-
128
-
129
-
130
-
131
-
132
-
133
-
 134
134 -
 135
135 -
 136
136 -
 137
137 -
 138
138 -
 139
139 -
 140
140 -
 141
141 -
 142
142 -
 143
143 -
 144
144 -
 145
145 -
 146
146 -
 147
147 -
 148
148 -
 149
149 -
 150
150 -
 151
151 -
 152
152 -
 153
153 -
 154
154 -
155
-
156
-
157
-
158
-
159
-
160
-
161
-
162
-
163
-
164
-
165
-
166
-
167
-
168
-
169
-
170
-
171
-
172
-
173
-
174
-
175
-
176
-
177
-
178
-
179
-
180
-
181
-
182
-
183
-
184
-
185
-
186
-
187
-
188
-
189
-
190
-
191
-
192
-
193
-
194
-
195
-
196
-
197
-
198
-
199
-
200
-
201
-
202
-
203
-
204
-
205
-
206
-
207
-
208
-
209
-
210
-
211
-
212
-
213
-
214
-
215
-
216
-
217
-
218
-
219
-
220
-
221
-
222
-
223
-
224
-
225
-
226
-
227
-
228
-
229
-
230
-
231
-
232
-
233
-
234
-
235
-
236
-
237
-
238
-
239
-
240
-
241
-
242
-
243
-
244
-
245
-
246
-
247
-
248
-
249
-
250
-
251
-
252
-
253
-
254
-
255
-
256
-
257
-
258
-
259
-
260
-
261
-
262
-
263
-
264
 |
 |
adidas Group
/
2013 Annual Report
Group Management Report – Financial Review
140
2013
/
03.2
/
Group Business Performance
/
Financial Statements and Management Report of adidas AG
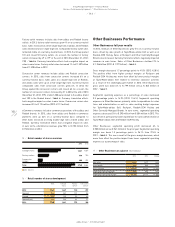
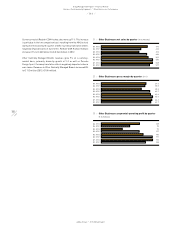
Other operating income down 8%
In 2013, other operating income of adidas AG decreased 8% to
€ 1.165 billion (2012: € 1.270 billion). This was primarily due to a decline
in income from currency conversion.
Other operating expenses decrease 4%
In 2013, other operating expenses of adidas AG declined 4% to
€ 1.981 billion (2012: € 2.055 billion). This decrease was largely
due to a decline in losses from currency translation and lower legal
and consultancy expenses, which more than offset an increase in
expenditure, in particular for marketing.
Depreciation and amortisation increases 14%
Depreciation and amortisation for adidas AG rose 14% to € 81 million
in 2013 (2012: € 71 million), mainly as a result of the depreciation and
amortisation of software.
Profit from operations declines
In 2013, profit from operations decreased 27% to € 168 million (2012:
€ 231 million). This was mainly due to the decline in other operating
income as well as the increase in depreciation and amortisation and
personnel expenses.
Financial result decreases
The financial result of adidas AG declined 88% to € 43 million in 2013
from € 350 million in 2012. This strong decrease is attributable to
lower profit transfers from affiliated companies under profit and loss
transfer agreements. In 2013, profit transfers decreased € 330 million
to € 6 million (2012: € 336 million). Income from investments in affiliated
companies increased 19% to € 102 million in 2013 (2012: € 86 million).
Net interest expense of adidas AG declined 14% to € 62 million in 2013
(2012: € 72 million). This development was mainly due to lower interest
paid to affiliated companies.
Net income down
Income from ordinary activities declined 64% to € 211 million in 2013
from € 581 million in 2012. This development is attributable to the
decline in the financial result and the lower profit from operations. Net
income for the year after taxes of € 111 million was € 100 million (2012:
€ 504 million).
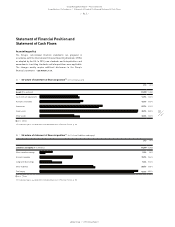
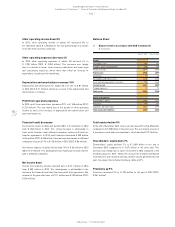
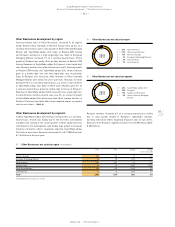
Balance Sheet
Total assets decline 5%
At the end of December 2013, total assets decreased 5% to € 6.694 billion
compared to € 7.030 billion in the prior year. This was mainly a result of
a decrease in cash and cash equivalents, which declined € 312 million.
Shareholders’ equity down 7%
Shareholders’ equity declined 7% to € 2.489 billion at the end of
December 2013 compared to € 2.672 billion in the prior year. This
decrease was mainly due to lower net income in 2013 compared to the
dividend payout for 2012. Taking into account the dividend distribution
from the prior year retained earnings and net income generated for the
year, the equity ratio remained relatively stable at 37%.
Provisions up 9%
Provisions increased 9% to € 393 million at the end of 2013 (2012:
€ 361 million).
60
/
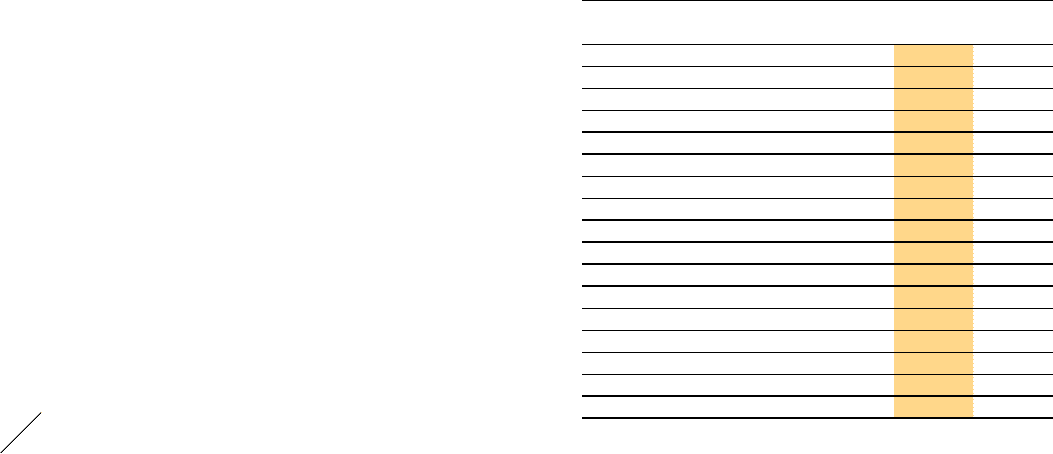
Balance sheet in accordance with HGB (Condensed)
(€ in millions)
Dec. 31, 2013 Dec. 31, 2012
Assets
Intangible assets 148 152
Property, plant and equipment 304 265
Financial assets 3,476 3,480
Fixed assets 3,928 3,897
Inventories 29 33
Receivables and other assets 1,928 1,976
Cash and cash equivalents, securities 736 1,048
Current assets 2,693 3,057
Prepaid expenses 73 76
Total assets 6,694 7,030
Equity and liabilities
Shareholders’ equity 2,489 2,672
Provisions 393 361
Liabilities and other items 3,812 3,997
Total equity and liabilities 6,694 7,030