Reebok 2013 Annual Report Download - page 163
Download and view the complete annual report
Please find page 163 of the 2013 Reebok annual report below. You can navigate through the pages in the report by either clicking on the pages listed below, or by using the keyword search tool below to find specific information within the annual report.-
 1
1 -
2
-
3
-
4
-
5
-
6
-
7
-
8
-
9
-
10
-
11
-
12
-
13
-
14
-
15
-
16
-
17
-
18
-
19
-
20
-
21
-
22
-
23
-
24
-
25
-
26
-
27
-
28
-
29
-
30
-
31
-
32
-
33
-
34
-
35
-
36
-
37
-
38
-
39
-
40
-
41
-
42
-
43
-
44
-
45
-
46
-
47
-
48
-
49
-
50
-
51
-
52
-
53
-
54
-
55
-
56
-
57
-
58
-
59
-
60
-
61
-
62
-
63
-
64
-
65
-
66
-
67
-
68
-
69
-
70
-
71
-
72
-
73
-
74
-
75
-
76
-
77
-
78
-
79
-
80
-
81
-
82
-
83
-
84
-
85
-
86
-
87
-
88
-
89
-
90
-
91
-
92
-
93
-
94
-
95
-
96
-
97
-
98
-
99
-
100
-
101
-
102
-
103
-
104
-
105
-
106
-
107
-
108
-
109
-
110
-
111
-
112
-
113
-
114
-
115
-
116
-
117
-
118
-
119
-
120
-
121
-
122
-
123
-
124
-
125
-
126
-
127
-
128
-
129
-
130
-
131
-
132
-
133
-
134
-
135
-
136
-
137
-
138
-
139
-
140
-
141
-
142
-
143
-
144
-
145
-
146
-
147
-
148
-
149
-
150
-
151
-
152
-
 153
153 -
 154
154 -
 155
155 -
 156
156 -
 157
157 -
 158
158 -
 159
159 -
 160
160 -
 161
161 -
 162
162 -
 163
163 -
 164
164 -
 165
165 -
 166
166 -
 167
167 -
 168
168 -
 169
169 -
 170
170 -
 171
171 -
 172
172 -
 173
173 -
174
-
175
-
176
-
177
-
178
-
179
-
180
-
181
-
182
-
183
-
184
-
185
-
186
-
187
-
188
-
189
-
190
-
191
-
192
-
193
-
194
-
195
-
196
-
197
-
198
-
199
-
200
-
201
-
202
-
203
-
204
-
205
-
206
-
207
-
208
-
209
-
210
-
211
-
212
-
213
-
214
-
215
-
216
-
217
-
218
-
219
-
220
-
221
-
222
-
223
-
224
-
225
-
226
-
227
-
228
-
229
-
230
-
231
-
232
-
233
-
234
-
235
-
236
-
237
-
238
-
239
-
240
-
241
-
242
-
243
-
244
-
245
-
246
-
247
-
248
-
249
-
250
-
251
-
252
-
253
-
254
-
255
-
256
-
257
-
258
-
259
-
260
-
261
-
262
-
263
-
264
 |
 |

adidas Group
/
2013 Annual Report
Group Management Report – Financial Review
159
2013
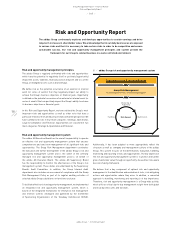
Risk and Opportunity Report
/
03.5
/
Our risk and opportunity management process contains the following
components:
/
Risk and opportunity identification: The adidas Group continuously
monitors the macroeconomic environment, developments in the
sporting goods industry, as well as internal processes, to identify risks
and opportunities as early as possible. The Risk Owners (i.e. all direct
reports to the adidas AG Executive Board and the Managing Directors of
all our markets) have primary responsibility for the identification of risks
and opportunities. The Group Risk Management department has defined
a catalogue of potential risk areas (Risk Universe) to assist Risk Owners
in identifying and categorising risks and opportunities. Our Group-wide
network of Risk Owners ensures an effective identification of risks and
opportunities. While various Risk Owners – according to their area of
responsibility – actively monitor the overall macroeconomic, political,
social, regulatory and competitive landscape, others closely observe
brand, distribution channel and price point developments as well as
changes in other areas such as input prices, financial market conditions
or technological developments.
The Risk Owners use various instruments in the risk and opportunity
identification process, such as primary qualitative and quantitative
research including trend scouting, consumer surveys as well as
feedback from our business partners and controlled space network.
These efforts are supported by global market research and competitor
analysis. Through this process, we seek to identify the markets,
categories, consumer target groups and product styles which show
most potential for future growth at a local and global level. Equally, our
analysis focuses on those areas that are at risk of saturation, or exposed
to increased competition or changing consumer tastes. However, our
risk and opportunity identification process is not only limited to external
risk factors or opportunities, it also includes an internal perspective
considering processes, projects, human resources or compliance
aspects.
/
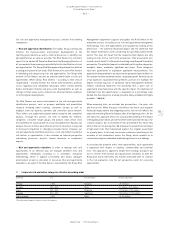
Risk and opportunity evaluation: In order to manage risks and
opportunities in an effective way, we evaluate identified risks and
opportunities individually according to a systematic evaluation
methodology, which is applied consistently and allows adequate
prioritisation as well as allocation of resources. Risk and opportunity
evaluation is also part of the Risk Owners’ responsibility. The Group Risk
Management department supports and guides the Risk Owners in the
evaluation process. According to our risk and opportunity management
methodology, risks and opportunities are evaluated by looking at two
dimensions – the potential (financial) impact and the likelihood that
this impact materialises, both considering the upcoming twelve-month
period. This does not mean that the respective Risk Owners are only
looking at risks from a short-term perspective. Their assessment also
includes a mid-term (12 to 24 months) and long-term (beyond 24 months)
perspective. The potential impact is evaluated by utilising five categories:
marginal, minor, moderate, significant and major. These categories
represent quantitative or equivalent qualitative measurements. The
quantitative measurements are based on the potential financial effect on
the relevant income statement metrics (operating profit, financial result
or tax expenses). Qualitative measurements used are, for example, the
degree of media exposure or additional senior management attention
needed. Likelihood represents the possibility that a given risk or
opportunity may materialise with the specific impact. The likelihood of
individual risks and opportunities is evaluated on a percentage scale
divided into five categories: unlikely, possible, likely, probable and highly
probable
/
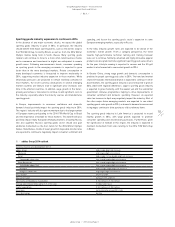
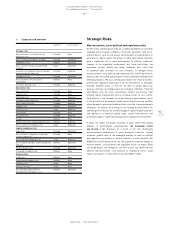
TABLE 02.
When assessing risks, we consider two perspectives – the gross risk
and the net risk. While the gross risk reflects the worst-case negative
(financial) impact before any mitigating actions, the net risk reflects the
expected remaining (financial) impact after all mitigating actions. On the
one hand, this approach allows for a good understanding of the impact
of mitigating action taken, and on the other hand it provides the basis for
scenario analysis. Our assessment of risks presented in this report only
reflects the net risk perspective. We measure the actual financial impact
of high-level risks that materialised against the original assessment
on a yearly basis. In this way, we ensure continuous monitoring of the
accuracy of risk evaluations across the Group, which enables us to
continuously improve evaluation methodology based on our findings.
In assessing the potential effect from opportunities, each opportunity
is appraised with respect to viability, commerciality and potential
risks. This approach is applied to longer-term strategic prospects but
also to shorter-term tactical and opportunistic initiatives at both the
Group and, more extensively, the market and brand level. In contrast
to the risk evaluation, only the net perspective exists for assessing
opportunities.
02
/
Corporate risk evaluation categories listed in ascending order
Likelihood in % Potential impact Financial equivalent 1)
Unlikely < 15% Marginal ≤ € 1 million
Possible 15% – 30% Minor € 1 million – € 10 million
Likely 30% – 50% Moderate € 10 million – € 50 million
Probable 50% – 85% Significant € 50 million – € 100 million
Highly probable > 85% Major ≥ € 100 million
1) Based on operating profit, financial result or tax expenses.